Location: Home >> Detail
J Psychiatry Brain Sci. 2025;10(5):e250014. https://doi.org/10.20900/jpbs.20250014
 ,
Vahid Shaygannejad 2 ,
Leila Esmaeili 3 ,
Omid Mirmosayyeb 2 ,
Mahshad Afsharzadeh 2 ,
Annette Beatrix Brühl 4 ,
Serge Brand 4,5,6,7,8,9 ,
Dena Sadeghi-Bahmani 4,10,11,*
,
Vahid Shaygannejad 2 ,
Leila Esmaeili 3 ,
Omid Mirmosayyeb 2 ,
Mahshad Afsharzadeh 2 ,
Annette Beatrix Brühl 4 ,
Serge Brand 4,5,6,7,8,9 ,
Dena Sadeghi-Bahmani 4,10,11,*
1 Department of Education and Psychology, Shahid Ashrafi Esfahani University, Esfahan 8179949999, Iran
2 Isfahan Neurosciences Research Center, Isfahan University of Medical Sciences, Esfahan 8174673461, Iran
3 Department of Education and Psychology, University of Isfahan, Esfahan 8174673441, Iran
4 Center for Affective, Stress and Sleep Disorders, Psychiatric Hospital of the University of Basel, Basel 4002, Switzerland
5 Division of Sport Science and Psychosocial Health, Department of Sport, Exercise and Health, Faculty of Medicine, University of Basel, Basel 4001, Switzerland
6 Health Institute, Substance Abuse Prevention Research Center, Department of Psychiatry, Kermanshah University of Medical Sciences (KUMS), Kermanshah 6714686698, Iran
7 Sleep Disorders Research Center, Department of Psychiatry, Kermanshah University of Medical Sciences (KUMS), Kermanshah 6714686698, Iran
8 Center for Disaster Psychiatry and Disaster Psychology, Psychiatric Hospital of the University of Basel, Basel 4002, Switzerland
9 Center of Competence of Disaster Medicine, Swiss Armed Forces, Basel 3063, Switzerland
10 Department of Psychology, Stanford University, Stanford, CA 94305, USA
11 Department of Clinical Psychology, The Wright Institute, Berkeley, CA 94704-1796, USA
* Correspondence: Dena Sadeghi-Bahmani
Background: Persons with multiple sclerosis (PwMS) reported lower emotional competencies (EC) and higher symptoms of depression (SD), compared to the general population. Mental Toughness (MT) reflects a person’s mental attitude to control their life, to stay committed to their aims, to perceive changes in life as a challenge, and to have confidence in their strengths. Research among the general population showed that MT had the potential to counterbalance SD. Here, we tested whether MT was related to SD and EC among a sample of PwMS.
Methods: A total of 1079 PwMS (mean age: 34.6 years; 81.1% females; median EDSS: 2) completed a series of self-rating questionnaires on sociodemographic and illness-related information, SD, EC, and MT.
Results: Higher scores for MT were associated with lower scores for SD (r = −0.61), and with higher scores for EC (r = 0.53), while higher SD scores were associated with lower EC (r = −0.42), The conditional effect model showed that higher MT scores were directly associated with higher EC scores, while the indirect association via depression was negligeable.
Conclusions: Among a large sample of PwMS, scores for MT, SD, and EC were intertwined. Further, MT was directly associated with SC. Given that standardized CBT intervention programs for MT, EC, and SD are available for the general population, to increase the well-being of PwMS, such interventions might also be suitable. The beauty of the study is that the present study appears to be one of the first studies to link MT and EC in a neurological population.
Compared to the general population, PwMS report a broad range of psychological health issues [1–3], including higher scores for depression [4–10], anxiety [5,8,10], sleep disturbances, including insomnia [11–15], and lower scores for EC [16].
Indeed, compared to the general population and individuals with major depressive disorder, PwMS reported more impaired EC [16]. Here, EC are understood as a person’s ability to understand emotions in self and others. More specifically, following Rindermann [17], EC comprise four key dimensions: 1. The perception and acknowledgement of one’s own emotions (e.g., “Sometimes I feel sad without knowing why”); 2. The regulation and control of one’s own emotions (e.g., “When I feel myself getting angry, I know how to cool down again”); 3. One’s emotional expressivity (e.g., “I can express my feelings very well”); and 4. The perception of others’ emotions (e.g., “I can perceive and describe my friends’ emotions very well”) [16,17]. Given the important role EC appear to play in well-being and social functioning, deficits in EC might be a key risk factor for MS-related impairments in well-being and social functioning.
Mental Toughness in Multiple SclerosisA cognitive-emotional concept to reflect a person’s ability to stay firm, focused, and achievement-oriented despite an adverse and challenging context is MT. MT reflects a person’s capacity to stay committed to one’s aims, to consider changes as challenges, to control one’s life, and to be confident in one’s skills and capacities [18]. In PwMS, MT was related to better sleep, higher physical activity, and lower scores for depression both cross-sectionally and longitudinally [19]. However, despite the broad utility of MT to describe a large variance of favorable cognitive-emotional and social behavior, including restorative sleep, both within and outside the context of sport performance [20–24], astonishingly, the association of MT with SD and EC has not been addressed so far neither in the general population, nor among PwMS, more specifically.
The Present StudyIn the present study, we tested the assumption that MT might be associated with higher scores for social competencies (SC) and lower scores for depression. Further, using a conditional effect model [25], we explored whether MT was associated with EC both directly and indirectly via lower scores for SD. To answer these questions, we performed a secondary analysis of previous data [16], though the present results are novel. In the first data analysis [16] we showed that lower scores for EC were associated with typically MS-related symptoms such as higher insomnia, fatigue, and paresthesia. Further, PwMS showed overall lower scores for EC when compared to the general population and to outpatients suffering from major depressive disorder.
The full description of the methods is reported in Sadeghi-Bahmani, Motl [16]. Briefly, PwMS registered at the Isfahan Neuroscience Research Center (INRC) of the Isfahan University of Medical Sciences (Isfahan, Iran) were approached to participate in the present cross-sectional and questionnaire-based study on EC and psychological well-being. Eligible participants were fully informed about the aims of the study and the confidential and anonymized data handling. Thereafter, they completed a series of self-rating questionnaires on sociodemographic and MS-related information, and questionnaires on SC, MT, and SD.
ParticipantsA total of 1079 individuals with MS (mean age: 34.6 years; 81.1% females; median EDSS: 2) took part in the study. Inclusion criteria were: 1. Aged 18 years and higher; 2. MS status following the McDonald’s criteria [26], and including the EDSS median score of <6, as ascertained by a trained and experienced neurologist. 3. Willing and able to comply with the study conditions; 4. Signed written informed consent. Exclusion criteria were: 1. Further neurological issues such as epilepsy, neuromyelitis optica spectrum disorder (NMOSD), or Clinically Isolated Syndrome (CIS) [27]; 2. Further psychiatric issues based on a clinical psychiatric interview [28]; 3. Acute suicidality; 4. Any adverse physical conditions, such as an acute relapse; 5. Withdrawal from the study.
Measures Emotional Competencies (EC)Participants completed the questionnaire on EC [16,17] (62 items; range: 62–248). Higher sum scores reflect higher EC (McDonald’s omega = 0.82).
Depression (SD)Participants completed the Farsi version [29] of the Beck Depression Inventory-Fast Screen (BDI-FS) [30] (seven items; range: 0–21). Higher scores reflect a greater severity of depressive symptoms (McDonald’s omega = 0.90).
Mental Toughness (MT)Participants completed the Farsi version of the 18-item short form of the MT Questionnaire [18] (18 items; range: 18–90). Higher sum scores reflect greater MT (McDonald’s omega = 0.89).
Statistical AnalysisTo understand the pattern of associations, we performed a series of Pearson’s correlations between scores for EC, SD, and MT.
To investigate whether MT or DS, or both, were more strongly and independently associated with EC, a multiple regression analysis was run. Preliminary conditions to perform a multiple regression analysis were met as follows [31,32]: 1079 > 100; independent variables explained the dependent variable (R = 0.550; R2 = 0.297); number of independent variables: 2 (SD, MT): 2 × 10 = 20 < 1079; the Durbin-Watson coefficient was 1.687, indicating that the residuals of the independent variables were statistically independent. Last, VIFs were between 1.580 and 1.850; while there are no strict cut-off points to report the risk of multicollinearity, VIF < 1 and VIF > 10 indicate multicollinearity [31,32].
To understand whether MT was associated with EC both directly and indirectly via lower scores for SD, we performed a conditional effect model [33,34].
Significant p-values are reported as: * = p < 0.05; ** = p < 0.01; *** = p < 0.001. All statistical computations were performed with SPSS® 29.0 (IBM Corporation, Armonk NY, USA) for Apple Mac®.
Table 1 reports the Pearson’s correlation coefficients and the descriptive statistics of EC, SD, and MT. Higher scores for EC were associated with lower scores for SD (r = −0.42 ***) and higher scores for MT (r = 0.53 ***). Higher SD scores were associated with lower scores for MT (r = −0.61 ***).
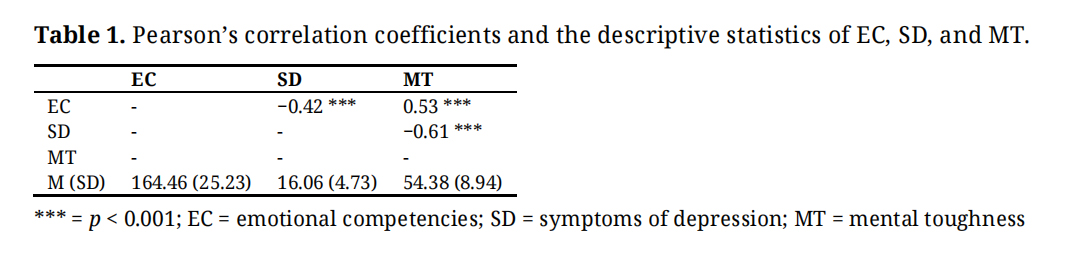 Table 1. Pearson’s correlation coefficients and the descriptive statistics of EC, SD, and MT.
Table 2 reports the multiple regression model. Lower scores for SD, and higher scores for MT were independently associated with higher scores for EC.
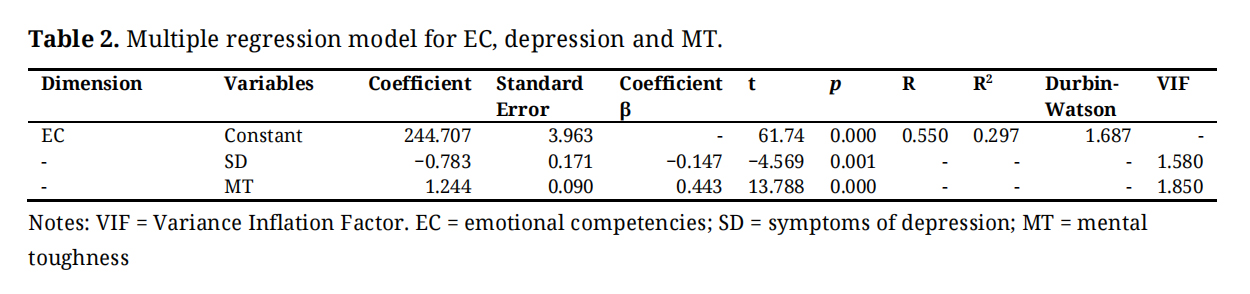 Table 2. Multiple regression model for EC, depression and MT.
From the correlational computations (Table 1) and the regression model (Table 2), the question was whether MT scores were directly and indirectly associated with EC via depression. To answer this, we performed a conditional effect model, and we followed [35]. Figure 1 shows the conditional effect model.
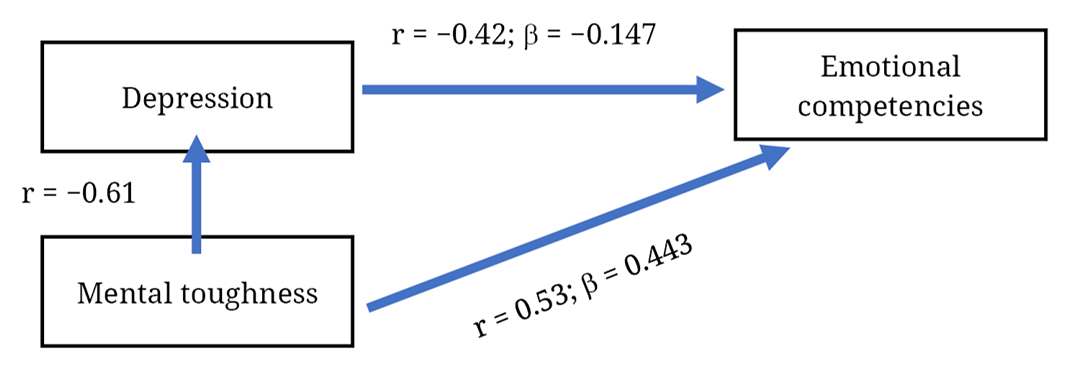 Figure 1. The equation model is as follows: rMT-EC = βMT-EC + (rMT-SD × βSD-EC); 0.53 = 0.443 + (−0.61 × −0.147) =; 0.53 = 0.442 + (0.0897).
From the conditional effect model it turned out that higher MT scores were directly associated with higher scores for EC, while the indirect association via SD was negligible.
The aims of the present secondary analysis were to investigate whether, among a large sample of PwMS, MT, SD, and EC were associated, and whether MT was directly and also indirectly associated with EC. It turned out that (1) EC, MT, and SD were intertwined (Table 1), that (2) higher scores for MT and lower scores for SD were independently associated with higher scores for EC, and that (3) higher scores for MT were directly associated with higher EC, but not indirectly via lower SD scores. The present pattern of results adds to the current literature in the following three ways. First, the present analysis is among the few that investigated dimensions of MT in a clinical context (here: persons with MS) and, above all, outside the area of sports psychology. Second, the present analysis appears to be just the second report on EC among PwMS, despite the importance of EC for the individual-social context-link. Third, a further novelty of the present analysis was that SD were statistically unimportant in explaining the MT-EC-link.
To explain the MT-EC link, we offer four theoretical concepts.
First, a closer look at the conceptual constructs of both MT and EC reveals a high plausibility of conceptual overlap. Indeed, while MT reflects a person’s ability to stay committed to one’s aims, to consider changes as challenges, to control one’s life, and to be confident in one’s skills and capacities [18,19], EC are understood as a person’s ability to perceive and acknowledge one’s own emotions, to express one’s emotion as a function of the social context, and to perceive others’ emotions [16,17]. As such, both conceptual constructs reflect a person’s ability of self-efficacy [36] and self-management [37,38].
Second, the transdiagnostic approach is an emerging field in psychiatry [39–45], which proposes that psychiatric disorders are not independent and isolated entities, but that they are intertwined. To make the case in point, treating insomnia is associated with improved depression and anxiety [46–50]. Plausibly, the logic suggests that higher scores for MT are mirrored and connected to higher scores for EC.
Third, the concept of allostatic load [51–53] may further help explain the MT-EC-link. Allostatic load is understood as the cumulative effects of stressful experiences in daily life, and such an allostatic load may lead to both physiological and psychological strain over time. Thus, almost by default, it is conceivable that higher scores for MT and EC reflect a rather dynamic behavior and a bi-directional process.
In this view, fourth, and given that both MT and SC are tightly associated with social behavior, at least three different social interactions are conceivable (cf. [54–57]: First, while an individual might react to social rules in a specific social context (reactive interaction), second, the individual also evokes distinctive responses in the social environment (evocative interaction). Third, an individual actively and selectively chooses their social environment, or: an individual is not only reactive and evocative in their social environment, but also creates their social world (proactive interaction). Such proactive interactions may further shape and impact what an individual believes and how the social world appears to function. With this in mind, it would be interesting to investigate whether and to what extent dimensions of reactive, evocative, and proactive behavior are associated with MT and EC.
In our opinion, such a dynamic and bi-directional process between MT and EC might also explain why SD were correlatively associated with both lower MT and EC, but had a negligible association to statistically explain the MT-EC-link (see Figure 1).
Limitations auture DirectionsThe present results should be balanced against the following limitations. First, by nature, the cross-sectional study design precludes causal associations, and a longitudinal design could have allowed us to understand if and to what extent MT scores could causally impact on EC, or vice versa. Second, it is conceivable that further unconsidered psychophysiological factors such as fatigue, insomnia, stress, along with medication intake and workplace-related issues, might have biased two or more dimensions in the same or opposite directions. This might hold particularly true for age and gender, though, in the first study [16], this sociodemographic information had no predictive value. Given this, age and gender were not further introduced in the present statistical procedures, and data were not further separately analyzed for gender. Third, we assessed PwMS with low to moderate physical impairment (EDSS < 6); consequently, the present results are not generalizable to PwMS with higher physical impairment. Fourth, participants’ answers on questionnaires were the only source of information, though above all as regards EC, it would be interesting and important to have further information from different sources of the social environment, such as partners, family members, colleagues at the workplace and at leisure time activities, and further significant others [58], including more objective observer ratings, behavioral tasks or clinician assessments. Fifth, the introduction of samples of individuals with chronic diseases or healthy controls would have allowed to understand whether and to what extent the pattern of results as reported in Figure 1 is typical to PwMS or generalizable to adults with and without chronic diseases, in general.
Clinical ImplicationsStandardized psychotherapeutic interventions to improve MT [24,59,60] and resilience (a cognitive-emotional concept often used interchangeably with MT) [61–63] already exist. While such interventions have been tested so far in the field of military training and elite sports, in the future, interventions specifically targeting to improve resilience and MT might also be tested in the field of psychotherapeutic treatments among PwMS [64]. However, the standardized interventions of Acceptance and Commitment Therapy (ACT) and Mindfulness-Based Stress Reduction (MBSR), two standardized, evidence-based, and internationally accepted psychotherapeutic interventions, already improved typical MS-related symptoms such as depression, insomnia, fatigue, and paresthesia, and considerably improved EC. Given this, and considering the concept of allostatic load, it is highly conceivable that improving resilience and MT among PwMS, they might also improve their EC, along with typical MS-related symptoms such as depression, insomnia, fatigue, and paresthesia, including cognitive impairments and fluctuating disability.
Among a large sample of PwMS, MT and EC were highly intertwined; higher MT scores were directly associated with higher EC scores, while SD could not further explain this MT-EC-link.
The Ethical Committee of the Isfahan University of Medical Sciences (Esfahan, Iran; code IR.MUI.MED.REC.1400.268) approved the study, which was performed in accordance with the seventh and current version [65] of the Declaration of Helsinki.
All participants signed the written informed consent.
Declaration of Helsinki STROBE Reporting GuidelineThis study adhered to the Helsinki Declaration. The Strengthening the Reporting of Observational studies in Epidemiology (STROBE) reporting guideline was followed.
Data may be made available under the following conditions: 1. An expert in the field asks for data. 2. There must be robust and strong hypotheses to support and justify the request. 3. A statement and evidence are needed to make sure that the data are securely stored. 4. A statement is needed to make sure that the data are not shared with third parties.
Conceptualization: LSB, VS, LE, OM, MA, ABB, SB and DS-B; Methodology: LSB, VS, LE, OM, MA, ABB, SB and DS-B; Validation: LSB, VS, LE, OM, MA, ABB, SB and DS-B; Formal analysis: LSB, VS, LE, OM, MA, SB and DS-B; Resources: LSB, VS, LE, OM, MA and DS-B; Data curation: LSB, MA, ABB, SB and DS-B; Writing—Original Draft Preparation: LSB, VS, LE, OM, MA, SB and DS-B; Writing—Review & Editing: LSB, VS, LE, OM, MA, ABB, SB and DS-B; Project Administration: LSB, VS, LE, OM, MA and DS-B.
All authors declare no conflicts of interest.
The study was performed without external funding.
1.
2.
3.
4.
5.
6.
7.
8.
9.
10.
11.
12.
13.
14.
15.
16.
17.
18.
19.
20.
21.
22.
23.
24.
25.
26.
27.
28.
29.
30.
31.
32.
33.
34.
35.
36.
37.
38.
39.
40.
41.
42.
43.
44.
45.
46.
47.
48.
49.
50.
51.
52.
53.
54.
55.
56.
57.
58.
59.
60.
61.
62.
63.
64.
65.
Bahmani LS, Shaygannejad V, Esmaeili L, Mirmosayyeb O, Afsharzadeh M, Brühl AB. Mental toughness, emotional competencies, and depression in multiple sclerosis. J Psychiatry Brain Sci. 2025;10(5):e250014. https://doi.org/10.20900/jpbs.20250014.

Copyright © Hapres Co., Ltd. Privacy Policy | Terms and Conditions


