Location: Home >> Detail
J Psychiatry Brain Sci. 2025;10(4):e250005. https://doi.org/10.20900/jpbs.20250005
 ,
Stephen Houghton 3 ,
Andre Gomez 4
,
Stephen Houghton 3 ,
Andre Gomez 4
1 School of Health and Biomedical Sciences, Federation University Australia, Ballarat, VIC 3353, Australia
2 College of Health and Biomedicine, RMIT University, 264 Plenty Road, Mill Park, VIC 3082, Australia
3 Graduate School of Education, University of Western Australia, Crawley, WA 6009, Australia
4 Wings Wellness Psychology Clinic, Melbourne, VIC 3029, Australia
* Correspondence: Rapson Gomez
This article belongs to the Virtual Special Issue "JPBS 10th Anniversary Special Issue"
Based on teacher ratings of Attention Deficit Hyperactivity Disorder (ADHD) symptoms, this study utilized network analyses to examine how teachers view ADHD symptoms and their associations with global functioning in a group of adolescents. Teachers (N = 934) rated the ADHD symptoms and global functioning of children (6 to 12 years; males = 46.68%), from the Malaysian general community. The network findings showed that for the inattention symptom group teachers viewed “making careless mistakes” and “difficulty following instructions” as most central; and for the hyperactive/impulsive symptom group, they viewed “on the go/driven by a motor” and “difficulty waiting for turn” as most central. Also, their ratings indicated that “trouble paying attention”, “difficulty following instructions”, “trouble getting organized”, “am often forgetful”, “runs/climbs when not expected” and “difficult waiting for turn” demonstrated the theoretically expected associations with global functioning. Overall, these findings should be prioritized when interpreting and using teachers’ reports of adolescents’ ADHD when used for assessment, diagnosis and treatment of adolescent ADHD. As this study is the first to use network analysis to examine teacher ratings of ADHD symptoms, the findings provide new contributions to the ADHD literature, in particular how teachers view ADHD in adolescents. However, in view of a number of study limitations, we offer our findings as preliminary.
According to the fifth edition of the Diagnostic and Statistical Manual of Mental Disorders (DSM-5; [1], ADHD is a neurodevelopmental disorder, characterized by two separate behavioral patterns of inattention (IA; 9 symptoms), and hyperactivity/impulsivity (HI; 9 symptoms). The symptoms are the same in DSM-IV [2] and DSM-IV TR [3]. To date, much of our understanding of the structure of ADHD symptoms is derived from latent variable models such as confirmatory factor analysis. A latent variable model provides a reflective view of psychopathology. As applied to a psychological disorder, it means that a latent (unobservable) construct (which is the disorder in question) causes a range of observable responses (that are the symptoms of the disorder). Although such models are still dominant in studies aimed at understanding the structure of psychopathologies, a newly developed formative view of psychopathology, referred to as the network approach to psychopathology, has been proposed. According to [4], central to this approach is that “symptoms of psychopathology are connected through myriads of biological, psychological and societal mechanisms. If these relations are sufficiently strong, symptoms can generate a level of feedback that renders them self-sustaining. In this case, the network can get stuck in a disorder state” (p. 5). Thus, from a network perspective, a mental disorder can be understood as arising from the interaction between the different symptoms in a network [5]. This network approach, which provides an alternative and novel approach to understanding psychopathologies, is now increasing in popularity for examining and understanding psychopathologies [6]. Although several studies have examined network models of ADHD for parent ratings, to date, only one study has examined this for teacher ratings. However, that study provided only limited network findings (i.e., only the network graph). Considering this, the major aim of the current study was to conduct and report more comprehensive network analysis findings for teacher ratings of ADHD symptoms.
Network AnalysisNetwork analysis is used to empirically test a network model [5,6]. The variables in a network model are referred to as nodes, and the connections between nodes are referred to as edge, each edge having a weight. weights. In the simplest network analysis, the edges are simply the correlations between each pair of variables. More often, partial correlations, controlling the relations between all other nodes, are computed. However, even in such instances, edge estimates could be inflated due to sampling error, and spurious edge estimates may be produced [7]. To overcome these problems, regularization can be used to estimate partial correlation networks [7]. When the regularization involves Markov Random Fields [8], the network will show only the more important associations or edges [5,9], suppressing spurious edges to zero. Consequently, the overall associations found in such a network will not correspond to the associations from zero-order correlations, partial correlation, multiple regression analyses, and structural equation modeling (SEM; [10]).
In terms of output, a network analysis produces a network graph, centrality values, and edge weights. The network graph is a visualization of the network structure and is easy to interpret [11]. The centrality value of a node reflects how well it is connected (which covers closeness, betweenness, degree, and influence; [12]). Closeness’ captures how close a node is to all other nodes by evaluating the inverse sum of the shortest paths between it and all other nodes. ‘Degree centrality’ captures how strongly a node is directly connected to other nodes, by summing the unsigned correlations between it and other nodes, in contrast to the ‘expected influence’ of a node, calculated as the sum of the signed correlations between it and other variables, and in which positive and negative edges will tend to cancel out.
For all these indices, nodes with higher centrality values are those that are more closely connected to other nodes. Expressed differently, more central nodes are more influential in the network [5,13]. Although centrality indices reflect the structure of the psychological network and not the dynamics of the network [11,14], some researchers have noted that the centrality indices could potentially provide some information about which symptoms are more important [15–17] and therefore could be more important targets for treatment.
Network Analyses of ADHD SymptomsTo date, seven studies have reported findings from network analyses that have included ADHD symptoms. Four of these studies have focused exclusively on the ADHD symptoms obtained using rating scales [18–21], while the other three have included other symptoms and areas of impairment, such as Oppositional Defiant Disorder (ODD; [22]), sluggish cognitive tempo symptoms (SCT; [23]), and SCT and various domains of impairment [24]. As the primary focus of the current study is exclusively on the 18 ADHD symptoms, the findings reported in the first four cited studies that focused exclusively on ADHD symptoms [18–21] can be seen as having potentially more relevance to the current study as the properties of a network are highly dependent on all the nodes that are included in the analysis [4]. These four studies all involved parent ratings of ADHD symptoms, however.
As will be noticed, past studies in this area have used parent and teacher ratings. In this context, the implicit assumption has been that ADHD ratings provide observable discrete realities of the symptoms, like high body temperature in the case of a fever. This assumption is problematic as ratings are linguistic constructs that provide a respondent’s textual descriptions of context-dependent behaviors that will not necessarily be viewed as describing the same underlying trait by different respondents. Considering this, it is suggested here that past studies in this area could be more appropriately viewed as addressing and providing data on respondents’ views of ADHD symptoms rather than addressing and providing data on the real (actual) properties of the ADHD symptoms. This distinction is not trivial or inconsequential, as it has major implications on findings based on indicators derived from rating scales. Consequently, we consider teacher ratings used in the current study as reflecting teachers' views of ADHD symptoms rather than non-contextual real measures of the ADHD symptoms.
Notwithstanding this, with reference to centrality, it was reported [18] that “easily distracted” and “fidgets with hand/feet” symptoms have relatively higher betweenness and closeness values than the other symptoms. “Difficulty following instructions” and “trouble engaging in work quietly” symptoms have relatively higher expected influence values than the other symptoms. According to [19], “trouble paying attention” and “easily distracted” have relatively higher closeness and degree values than the other symptoms, while [20] reported that “trouble paying attention” and “easily distracted” have relatively higher expected influence values than the other symptoms. It has also been reported [21] that “trouble getting organized” and “interrupts/intrudes on others” symptoms have relatively higher betweenness and closeness values than the other symptoms.
In contrast to findings related to centrality, the findings for edge weights have been less often reported. Notwithstanding this, existing findings appear to indicate different symptom clusters for the IA and HI symptom groups. That is, the different HI and IA groups of symptoms are more closely associated with each other than across each other (e.g., [19,21]). There are also some data indicating close links across different symptom groups, for example, the symptom “talks excessively” with the other impulsive symptoms; “trouble paying attention” with “fidgets with hands/feet”; symptoms for “runs/climbs when not expected”, “leaves seat when not expected” and “on the go/driven by a motor” with each other, and for all these symptoms with the “fidgets with hand/feet” and “trouble engaging in work quietly” symptoms [19]. There are also network analysis data showing associations of ADHD symptoms with impairment in several domains [24], although these findings may be confounded as this network also included SCT symptoms.
The study by [19], also included teacher ratings of ADHD symptoms. However, the results section in that study focused almost exclusively on network findings for parent ratings. In relation to teacher ratings, it merely mentioned that results were comparable to parent ratings, based on visual comparison of the network graphs across parent and teacher ratings. In this respect, our own check of the same data did not lead to a similar conclusion. Unfortunately, [19] did not conduct statistical tests for invariance across parent and teacher ratings that can be done using the R Studio package for Network Comparison Test (NCT; [25]). Also, other network psychometric properties, such as centrality, edge weights, and network stability were not reported for teacher ratings. Considering this, it can be argued that the currently available information on the network properties of teacher ratings of ADHD symptoms is extremely limited and questionable, and that this area needs to be reinvestigated.
Limitation of Existing Network Analysis FindingsOverall, when parent ratings are considered, there is some interesting data on the network properties of ADHD symptoms. However, when teacher ratings are considered, existing data is very limited and questionable. This is surprising given that teacher reports/ratings of ADHD symptoms are routinely used to establish the mandatory cross-situation requirement for the diagnosis of ADHD [26]. Additionally, there are reasons to suspect that the network properties for teacher ratings of ADHD symptoms could differ from those of parents. This is because existing findings have shown consistently that there is very low agreement between parent and teacher ratings of ADHD symptoms [27–30]. More specifically, studies suggest that IA symptoms have far more trait variances for parent ratings than teacher ratings, and HI symptoms have far fewer trait variances for parent ratings compared to teacher ratings. The poor agreement between parents and teachers has been explained in terms of either situational specificity of the ADHD symptoms at home and at school, or differences in parent and teacher perceptions for ADHD symptoms [27,28,30,31]. Considering this, and as existing network data for teacher ratings are limited and questionable, studies of the network properties of ADHD symptoms for teacher ratings would be clinically valuable. They can advance our current knowledge and understanding of ADHD, especially from a teacher’s perspective. Knowing the more central symptoms and the unique associations between the different ADHD symptoms can facilitate treatment and intervention of ADHD. Also, if such a network model includes other variables (for example global impairment), it will show important relations between the ADHD symptoms and the other variables, which could in turn have useful clinical implications. For example, including functional impairment in the ADHD network and ascertaining how the ADHD symptoms in the network are associated with functional impairment will lead to a greater understanding of ADHD that will facilitate better designed and targeted interventions to reduce functional impairment.
Aims of the Current StudyGiven the literature presented, the major aim of the current study was to use network analysis, with regularized partial correlation, to examine how teachers view children with ADHD and how they characterize their patterns of behaviour as listed in the DSM descriptors, based on ratings, in a large Malaysian community sample. In addition, we revised the network model by including global functioning and used network analysis to examine how, from a teacher’s viewpoint, the 18 ADHD symptoms were associated with global functioning. Global functioning was focused on as it was thought to be clinically meaningful, given that this is included as Axis V in the DSM-111 R and DSM-IV multiaxial diagnostic system. In the absence of relevant network analyses for ADHD ratings for teacher ratings, we made no specific predictions. However, based on existing expected influence (the indices used in the current study to infer centrality) in past network analysis findings for parent ratings of ADHD symptoms [20], it was cautiously suspected that “easily distracted”, and “difficulty sustaining attention” would be among the symptoms with the higher centrality values. For edge weight, we speculated that the IA symptoms would be more closely associated with each other, and the HI symptoms more closely associated with each other, with these sets not being as closely associated with each other (or different sections of the network). In addition, the IA symptoms would be more closely associated with each other than the HI symptoms. As this study is exploratory, and considering the limited existing edge weight data, no specific predictions were suggested for edge weights. However, while we made no specific speculation at the individual symptom level, we did speculate that generally, the ADHD symptoms would be associated positively with global functional impairment.
This study used archival data that were collected originally to examine the factor structure of ADHD symptoms, based on parent and teacher ratings, of Malaysian primary-school aged children [32]. We did not include a focus on parent ratings as there already exist numerous such studies (reviewed earlier in the introduction). The participating teachers were from 14 randomly selected primary schools from Johor, a state in Malaysia. In our original study, ethics approval from [Masked Ministry] did not allow the collection of demographic information of teachers who participated in the study or any identification of teachers who participated. In all, these teachers rated 934 children (436 boys and 496 girls), ranging in age from 6 years to 12 years. The mean ages (SD) for boys and girls were 8.86 years (1.62 years) and 9.02 years (1.73 years), respectively. Ethnically, 574 (61.5%) were Malays, 247 (26.4%) were Chinese, 98 (10.5%) were Indians, and 15 (1.6%) belonged to the other categories. This distribution is close to the Malaysian population. Educationally, most parents of children who were rated completed primary and secondary school level education. Occupationally, they were predominantly in skilled/semi-skilled employment.
MeasuresAll teachers completed the Disruptive Behavior Rating Scale (DBRS; [33]) and the non-clinician version of the Children’s Global Assessment Scale (NC-CGAS; [34]).
Disruptive Behavior Rating ScaleThe teacher version of the DBRS was used to obtain teacher ratings of the 18 DSM-IV (same in DSM-5) ADHD symptoms. For each symptom, respondents (i.e., teachers) rated the occurrence of the symptoms over the previous 6 months on a four-point scale, ranging from 0 (never or rarely) to 3 (very often). The Cronbach’s alpha values for the original four-point scale were 0.96, 0.95 and 0.93 for ADHD (IA plus HI), IA and HI symptoms, respectively.
Children’s Global Assessment ScaleThe CAGS [34] was initially developed for clinicians to score a child’s lowest level of overall functioning during the past 6 months using a scale from 1 to 100. Informants assign a single numeric score at any point on this scale, with higher scores indicating better global functioning. Respondents are asked to consider both behavioral and emotional functioning to account for functioning at home with the family, at school, with friends, and during leisure time. A simplified non-clinician version of this measure (the NC-CGAS) is available for completion by lay interviewers. The NC-CGAS has sound psychometric properties, including the ability to distinguish between children with and without emotional and behavioral disorders [34]. Although the NC-CGAS is generally based on parent ratings, for the current study, teachers were asked to provide ratings for NC-CGAS using the 1 to 100 scale. This was considered appropriate as the NC-CGAS was developed for completion by lay interviewers, and not exclusively parents. Related to this, we could not find existing data on the psychometric properties of the NC-CGAS when completed by teachers. For parent completion, this measure showed support for its reliability and validity [35]
ProcedureUsing a random number table, 14 schools were selected for participation. All schools agreed to participate. Teachers of classes proposed by the relevant school principals were provided with the appropriate number of sealed envelopes (with a plain language statement of the study, the consent form, and a return envelope) to be forwarded to parents, through their students. The letter to parents in both Malay and English indicated that the study was examining aspects of childhood behavior in schools and sought their participation. If willing, they were asked to complete the consent form that also requested the relevant child’s age, gender, ethnicity, and their willingness to have the children’s class teachers complete the relevant questionnaires. The teachers of children with this consent were then given sealed envelopes with the research material (plain language statement of the study, DBRS, NC-CGAS, the consent form, and a return envelope) and requested to complete the DBRS and NC-CGAS only for those children with permission from parents for their teachers to rate their children. Teachers were provided with both English and Malay versions of the DBRS, with instructions to select either version. The Malay version was developed via forward and backward translation by experts in both languages. The functional and psychometric equivalence of the two language versions was examined by the language experts and via evaluation of measurement invariance using item response theory. Although details are not provided here, a previous study showed measurement invariance across the language versions [36]. In all, 934 children were rated on both the DBRS and NC-CGAS by their teachers (a participation rate of approximately 93% for children), with 202 teachers completing the English version of the DBRS. In view of the conditions associated with ethical approval for this study, and the subsequent manner in which data was collected, we were not able to obtain valuable information for the study, such as background information of the teachers who provided ratings, the identity of the teachers who completed the ratings for the different children, and number of students and descriptives of the ADHD symptoms (mean and SD) rated by each teacher.
Statistical Procedure Evaluating the Factor Structure of ADHD SymptomsAs a baseline against which to compare our ADHD network model, we evaluated the structure of ADHD symptoms using confirmatory factor analysis. For this, we examined the fit and factor loadings of a 2-factors oblique model with latent factors for IA and HI. The model used mean and variance-adjusted weighted least squares (WLMSV) estimator, with the ADHD symptoms scored as categorical variables. The CFA models were conducted using Mplus (Version 7) software [37]. Model fit was evaluated using the root mean squared error of approximation (RMSEA), the comparative fit index (CFI), and the Tucker-Lewis Index (TLI). The guidelines suggested by [38] are that RMSEA values close to 0.06 or below suggest a good fit, 0.07 to <0.08 as a moderate fit, 0.08 to 0.10 as a marginal fit, and >0.10 as a poor fit. For the CFI and TLI, values of 0.95 or above are taken as indicating good model-data fit, and values of 0.90 and <0.95 are taken as marginally acceptable fit. In this model, item loadings of ≥0.03, indicative of a moderate correlation between the item and the factor, were considered salient [39].
Estimation of Sample Size for the StudyEstimation of sample size for a network analysis is complex, and to date there is no acceptance of a preferred method to establish this [7,8,40]. Although Monte Carlo simulation methods have been proposed for this (e.g., [40]), they are generally computationally demanding, and do not address all the concerns faced with sample size estimation in a network. Considering this, we estimated our sample size requirement using a straightforward approach illustrated by [41]. According to them, at a general level, the sample size needs to be more than the number of estimated parameters in the model. The initial network analysis focused on the 18 DSM-IV ADHD symptoms. Consequently, it included only the 18 ADHD symptoms. With 18 nodes in the network, the total number of estimated parameters was 190 [(19) + (18 × 19/2)] [41]. The revised network analysis focused on the relationship between the 18 ADHD symptoms and global functioning. As there were 19 variables in the revised analysis, the number of estimated parameters was 210 [(20) + (19 × 20/2)]. As our sample size of 934 was more than the number of estimated parameters in both network models, our sample size was deemed sufficient for both network analyses [7].
Testing the Network ModelsFor both the initial and revised network analyses, the network module in Jeffreys’ Amazing Statistics Program (JASP) version 0.14.1.0 [42] was used. This module uses the R package for botnet [7,8] to conduct network analyses [43], and the qgraph to conduct network graphs. The module applies the least absolute shrinkage, together with the extended Bayesian Information Criterion (EBIC) model selection to produce regularized partial correlation networks [44]. With the gamma hyperparameter set at 0.5, it will produce network models that are sparser and easier to interpret [7,8,44]. It will show only the more important associations or edges [5,9], suppressing spurious edges to zero.
Given the aims of the initial network analysis (focused on the network properties of only the 18 ADHD symptoms), our results for this network will focus on the network graph (data structure), centrality and edge weight values. We will also report the results related to establishing the stability and reliability of the centrality and edge weight findings. As our revised network model was aimed at examining the associations of the 18 ADHD symptoms with global functioning, the focus will be on only edge weights. Centrality is not relevant for this purpose.
The network graph is produced in ways to make it easy to interpret. More similar nodes are positioned closer to each other, and edge connections are colored so that positive associations are in blue and negative associations are in red. Additionally, stronger relationships have thicker and denser lines. An algorithm [45] was applied to the position of the nodes. Therefore, nodes with stronger correlations were placed near the centre, and the nodes with weaker correlations were positioned in the periphery.
As mentioned in the introduction, the commonly reported indices of centrality are betweenness, closeness, degree (strength), and expected influence. Although we report all four centrality indices, expected influence is used for evaluating the centrality of the nodes because it considers both positive and negative edges in the network and therefore avoids the interpretative challenges found for the other centrality indices [13]. In a network, all edges that are present are significant (controlling for the other nodes in the network), whereas edges that are not significant will not be shown. For ease of interpretation of the edge weights, effect size guidelines [46] were used (negligible ≤ 0.14, small = ≥0.15 to <0.25, moderate ≥0.25 to <0.35, and large ≥ 0.35), with large and moderate effect sizes considered especially important.
When a network analysis is conducted, it is expected that the stability and reliability (i.e., likelihood that the network results will be replicated) of the centrality and edge findings be evaluated and reported. For the current study, this was evaluated for edge weights using bootstrap 95% non-parametric confidence intervals (CIs), with narrower CIs suggesting a more precise estimation of the edge [7,8]. The stability of the centrality indices was evaluated using the case-dropping bootstrap [7,8]. This procedure examines if the correlation stability coefficients of the centrality indices remain stable after re-estimating the network with fewer cases. Generally, stability coefficients of 0.7 or higher are desired, although values above 0.5 are considered acceptable [7,8]. Both edge weight and centrality index stability were estimated using 1000 bootstrap samples.
Dealing with the Nested Nature of the DataAs several children were rated by the same teacher and there were several teachers who provided ratings, our data were nested (i.e., ratings were nested within teachers). This is problematic as it violates the assumption of independent observations, thereby raising the possibility of misleading and inaccurate results when using standard network analysis techniques (as in the case with the JAPS network module). Although R packages are available for computing network analysis with nested data (for example, igraph, tidygraph, and ggraph), we did not use them as we did not have all the information required to run them. As noted earlier, ethical approval did not allow for the collection of information identifying the teachers who completed the ratings for the different children, and that is needed to run these R packages.
Sensitivity AnalysisAs the data set used for the network analyses was nested and we did not have all the information to run the appropriate R packages that could have accounted for this, we checked for potential confounding effects from the nested nature of the data set by conducted sensitivity analysis. For this, we randomly reduced the original entire sample to approximately 50% (N = 468). As can be expected, the nestedness in the data for this reduced sample would be different from that of the original full sample. Consequently, we reasoned that if the network parameter estimates across these two samples were the same, it could be interpreted as suggesting that the nested nature of the data was not contributing to the estimation of network parameters in their network models. However, if the network parameter estimates across these two samples were different, it could be interpreted as suggesting that the nested nature of the data was contributing to the estimation of network parameters in the network models. For the sensitivity analysis, we used Kendall’s tau and Spearman’s rho to examine the correlation for the centrality indices expected influence (chosen randomly). Both these analyses will show how well the rank order of expected influence for the full sample corresponds with the rank order of expected influence for the reduced sample.
The mean and standard deviation scores for all 18 ADHD symptoms and global functioning are shown in the Supplementary Material Table S1. Although not shown, all response categories (0 to 3) were endorsed for all 18 symptoms. There were no missing values for the data set. The DBRS item ratings can be recoded so that response options 0 and 1 can be inferred as symptoms being absent (rescored as 0), and response options 2 and 3 can be inferred as symptoms being present (recoded as 1; [47]). For these recoded scores (see method section), the mean (SD) scores for IA and HI were 1.526 (SD = 2.602) and 0.911 (SD = 2.076), respectively. The frequency of individuals who scored six or more IA symptoms and 6 or more HI symptoms (the threshold for the number of symptoms for identifying the presence of these symptom groups) were 107 (11.5%) and 54 (5.8%), respectively. Overall, 13.3% met this threshold. Among those meeting the thresholds for either IA, HI, or both, the frequencies of the different ADHD types were examined. The frequencies for the combined, inattentive, and hyperactive/impulsive types were 37 (4.0%), 70 (7.5%) and 17 (1.8%), respectively.
Confirmatory Factor Analysis of the ADHD SymptomsThe fit values for the oblique 2-factor ADHD model were as follows: WLSMVχ2 = 1265.521, p < 0.001; RMSEA = 0.095 (90% CI = 0.090–0.100); CFI = 0.972; TLI = 0.968. Thus, the CFI and TLI indicated a good model fit while the RMSEA indicated a marginal model fit. Supplementary Material Figure S1 shows the standardized factor loadings for the different symptoms in the model. All factor loadings were significant (p < 0.001), and salient (>0.03).
Network AnalysisWith 18 variables (nodes) in the initial network of ADHD symptoms, there was a possibility of a total 153 interconnections (edges). However, as the EBIC glasso estimation was applied, the number of edges that was actually estimated was 111, i.e., sparsity = 0.27.
Visualization of the NetworkThe relationships of the nodes (ADHD symptoms) in the network are presented visually in Figure 1. As shown, the sets of IA symptoms and the HI symptoms were grouped together and positioned in different sections in the network. The strongest connection between the IA and HI symptoms was IA “does not seem to listen” with HI “trouble engaging in work quietly”. The edges were of varying lengths, intensities and thickness, and included many with blue and red colors (i.e., positive and negative edges). Together these indicate variability in strengths and directions of the association between the nodes.
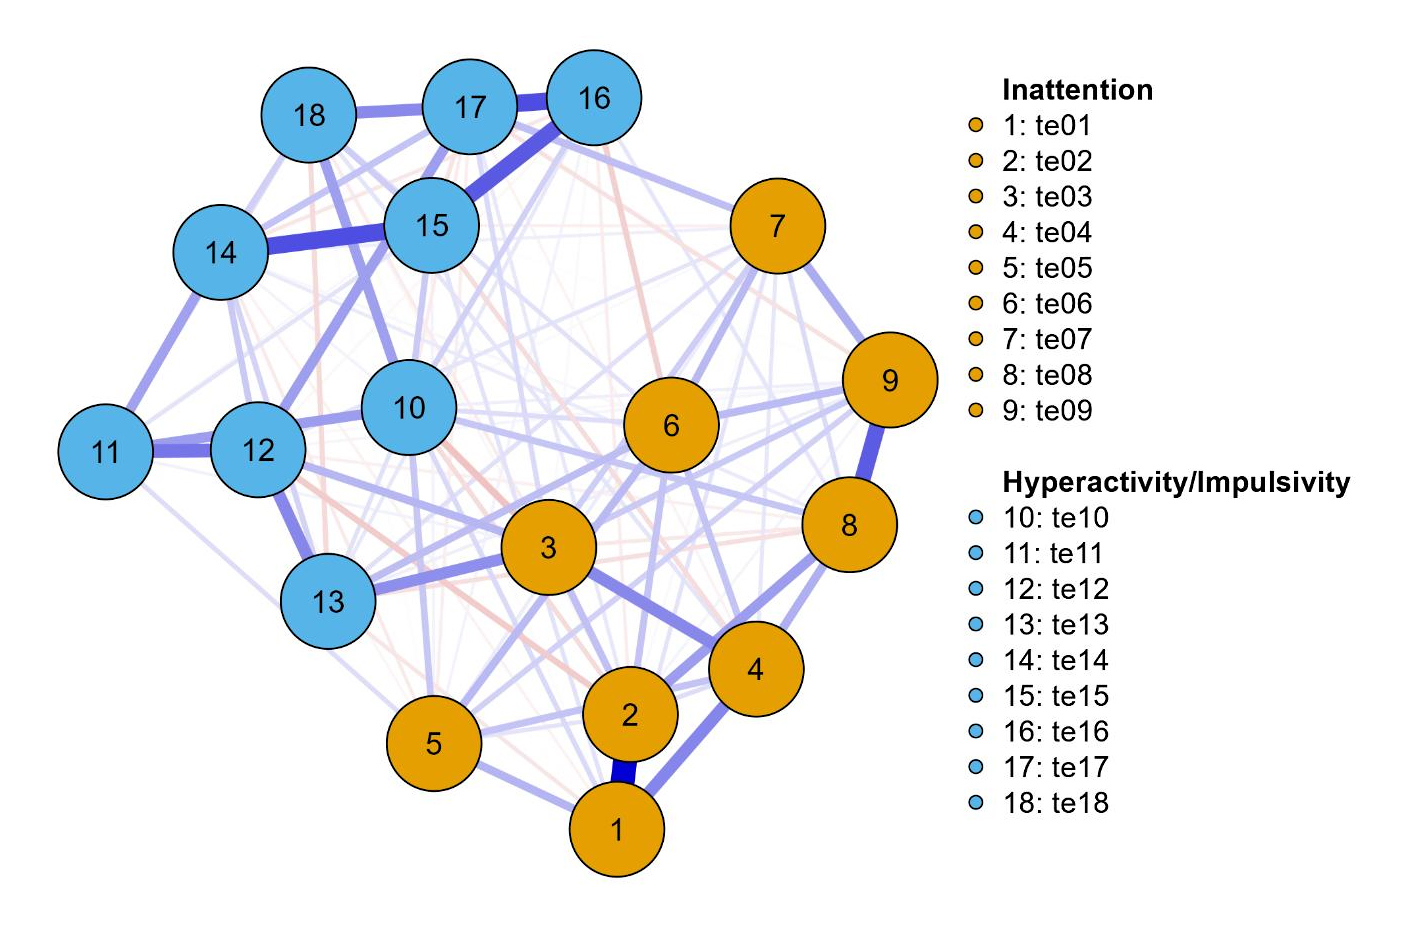 Figure 1. Network of ADHD symptoms. Note: te1 = Careless; te2 = Inattention; te3 = Listen; te4 = Instruction; te5 = Disorganized; te6 = Avoids task; te7 = Lose; te8 = Distracted; te9 = Forgetful; te10 = Fidget; te11 = Seat; te12 = Run; te13 = Quiet; te14 = Motor; te15 = Talk; te16 = Blurt; te17 = Wait; and te18 = Interrupt. Blue lines represent positive associations and red lines negative associations. The thickness and brightness of an edge indicates the association strength. The layout is based on the algorithm [45] that places the nodes with stronger and/or more connections closer together and the most central nodes into the center. See Table 1 for brief descriptions of the nodes.
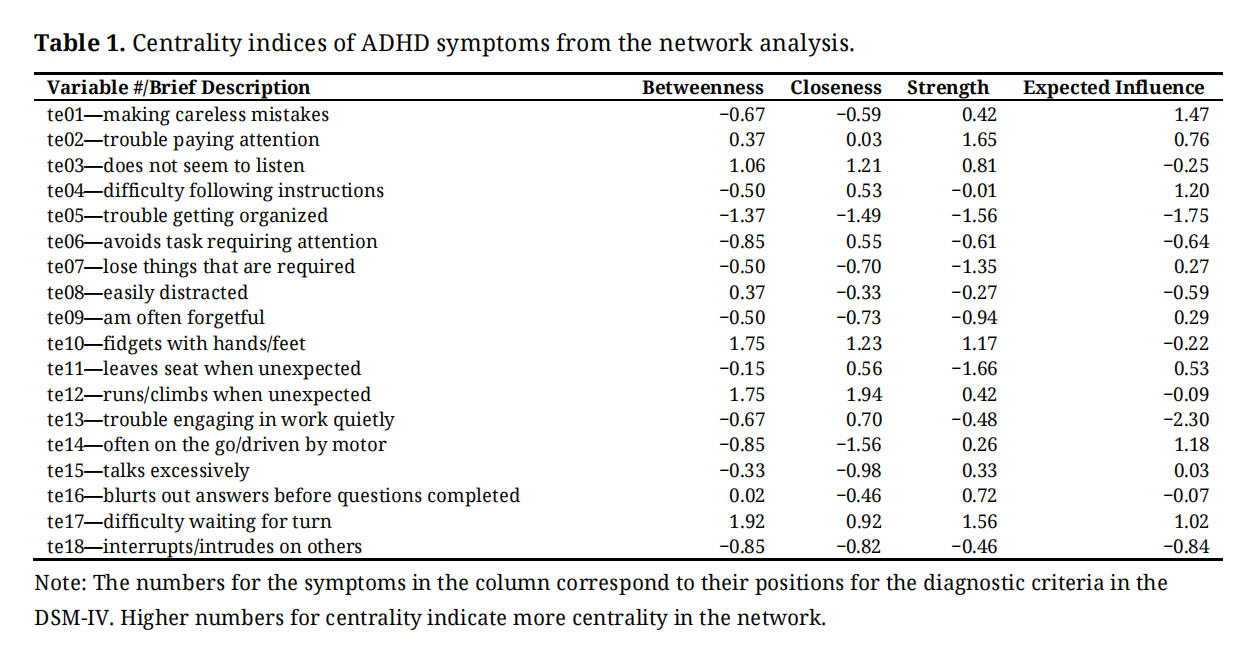 Table 1. Centrality indices of ADHD symptoms from the network analysis.
Supplementary Material Figure S2 and Table 1 show the centrality of the nodes in the network. As can be seen, the three symptoms with the highest centrality based on expected influence values were IA “makes careless mistakes”, and “difficulties following instructions”, and HI “on the go/driven by a motor”. For the IA symptoms, the two highest values were “making careless mistakes”, and “difficulty following instructions”; and the two lowest values were “trouble getting organized”, and “avoids tasks requiring attention”. For the HI symptoms, the two with the highest values were “on the go/driven by motor”, and “difficulty waiting for turn”; and the two with the lowest values were “trouble engaging in work quietly”, and “interrupts/intrudes on others”.
Edge Weights in the NetworkTable 2 shows the weight matrix between these nodes. Given the breadth and complexity of the relations when effect sizes are considered, we have represented the edge in a tabular form, shown in Supplementary Material Table S2. In this main manuscript, we will describe only the main findings. A full description of all the relationships is presented in Supplementary Material Table S3.
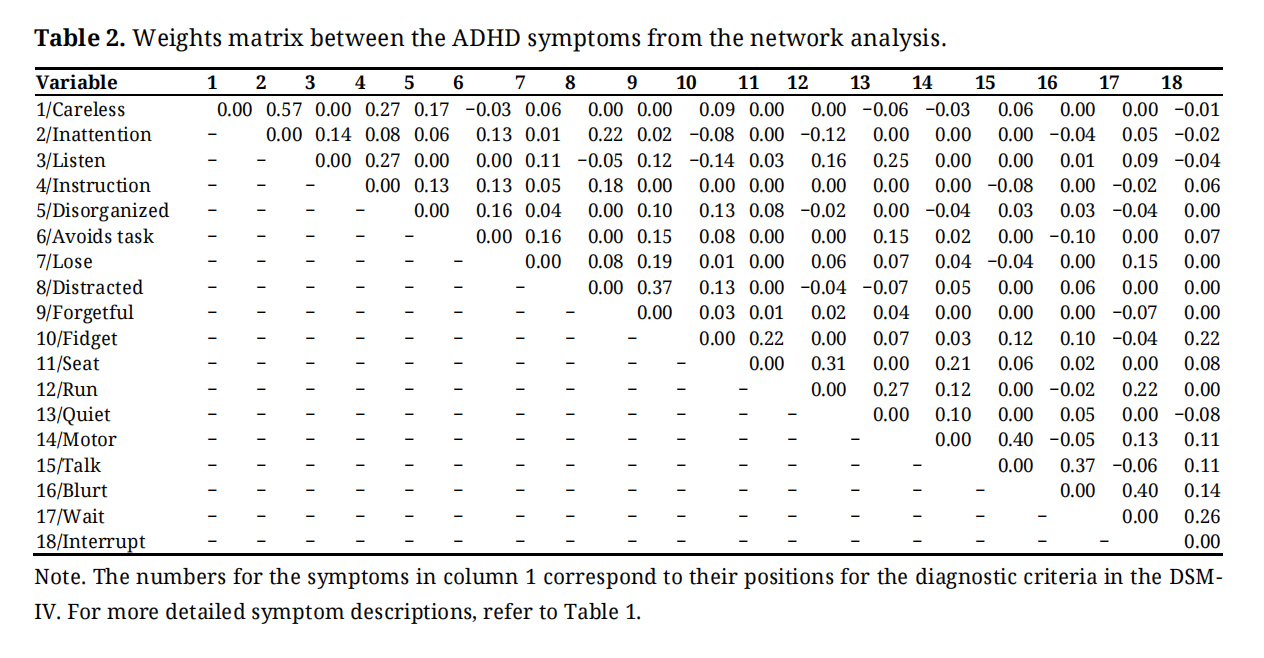 Table 2. Weights matrix between the ADHD symptoms from the network analysis.
As shown in Table 2, for the IA symptoms, 27 out of 55 edges were significant. Of these, there were 25 positive edges and 2 negative edges. For the positive edges, there were large or moderate effect sizes for four edges: “making careless mistakes” with “trouble paying attention”, “making careless mistakes” with “difficulties following instructions”, “does not seem to listen” with “difficulty following instructions”, and “easily distracted” with “am often forgetful”. Thus, only 7.27% of nodes had positive effect sizes that were considered important and worthy of interpretation. All the negative edges were of small or negligible effect sizes, and therefore not worthy of interpretation.
Within HI SymptomsTable 2 shows that for HI symptoms, 29 out of 55 edges were significant. Of these, there were 24 positive edges and 5 negative edges. For the positive edges, there were large or moderate effect sizes for six edges: “leaves seat when not expected” with “runs/climbs when not expected”, “runs/climbs when not expected ” with “trouble engaging in work quietly”, “often on the go/driven by a motor” with “talks excessively”, “talks excessively” with “blurts out answers before question completed”, “blurts out answers before question completed” with “difficulty waiting for turn”, and “difficulty waiting for turn” with “interrupts/intrudes on others”. Thus, only 10.90% of nodes had positive effect sizes that were considered important and worthy of interpretation.
Between IA with HI SymptomsAs shown in Table 2, for the associations between the IA and HI symptoms, no node had a large effect size, and only one had a moderate effect size. This was a positive association between “does not seem to listen” and “trouble engaging in work quietly”. Thus, only one edge could be considered important and worthy of interpretation.
Overall, therefore, our findings showed relatively low levels of associations within the IA symptoms, within the HI symptoms, and across the IA and HI symptom groups, with most of the associations being of small or negligible effect sizes, and some even negative.
Stability of the Accuracy of Edge Weights and Centrality Strength IndexAs mentioned, the stability of the edges was estimated using bootstrap 95% non-parametric CIs. The results are shown in Supplementary Material Figure S3. As almost all the 95% CI of the edges included zero, and the CIs around the estimated edge weights were relatively small, stability of the edge findings can be assumed.
The case-dropping bootstrapping method was used to examine the stability of the centrality indices. The results of this are shown in Supplementary Material Figure S4. Generally, stability coefficients of 0.7 or higher are desired, although values above 0.5 are considered acceptable [7,8]. The figure shows that the stability coefficient remained above 0.5 until a decrease of around 30% of the original sample. When the sample was decreased to 25%, the stability coefficients dropped to below 0.5. Thus, our findings in this respect should be interpreted with caution [7,8].
Edge Weights in the Revised Network Model with Global FunctioningTable 3 shows the edge weights for the ADHD symptoms with global functioning (where higher scores indicate higher functionality) in the revised network model that included global functioning. As can be seen, four IA symptoms (“trouble paying attention”, “difficulty following instructions”, “trouble getting organized”, “an often forgetful”) and two HI symptoms (“runs/climbs when not expected” and “difficulty waiting for turn”) were associated negatively and significantly with global functioning. Three HI symptoms (“fidgets with hands/feet”, “trouble engaging in work quietly” and “talks excessively”) showed positive and significant associations with global functioning. All the significant associations were of negligible effect sizes.
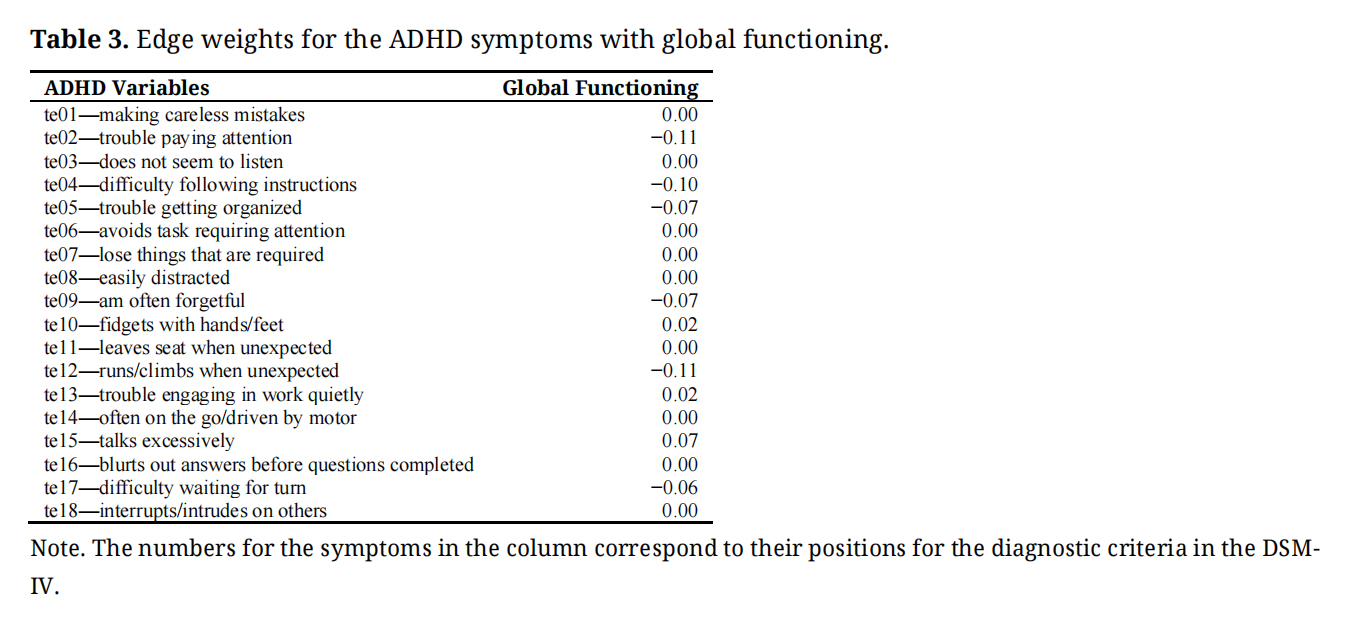 Table 3. Edge weights for the ADHD symptoms with global functioning.
Supplementary Material Figure S4 shows the expected influence centrality values (used for the sensitivity analysis) for the original full sample and the reduced sample. The correlations for the expected influence across these samples were significant (Kendall’s tau = 0.630, p < 0.001; Spearman’s rho = 0.795, p < 0.001), thereby indicating significant comparability in their rank orders. Interestingly the Pearson’s correlation coefficients were also significant (r = 0.899, p < 0.001).
The main aim of this study was to examine teachers’ views of ADHD symptoms (initial model) in terms of network characteristics, in a group of children from the general Malaysian community. A secondary aim was to use network analysis (revised model) to examine how teachers view the relationships of ADHD symptoms with global functioning.
To summarize, for teachers’ views of ADHD symptoms, the network graph that included only the 18 ADHD symptoms (initial model) showed that the IA and HI symptom groups were in separate sections of the network graph. The strongest connection between the IA and HI symptoms was for IA “does not seem to listen” with HI “trouble engaging in work quietly”. Also, there was variability in the strengths and directions of the associations between the nodes. For centrality (evaluated using expected influence), the three symptoms with the highest centrality values were IA “making careless mistakes” and “difficulty following instructions” and HI “on the go/driven by a motor”. For the IA symptoms on their own, “making careless mistakes” and “difficulty following instructions” had the two highest values, and “trouble getting organized” and “avoids tasks requiring attention” had the two lowest values. For HI symptoms on their own, “on the go/driven by motor” and “difficulty waiting for turn” had the two highest values, and “trouble engaging in work quietly” and “interrupt/intrudes on others” had the two lowest values. For edge weights, for the IA symptoms, there were positive and large effect size associations for “making careless mistakes” with “trouble paying attention”, and “easily distracted with “am often forgetful”. For HI symptoms, there were positive and large effect size associations for “on the go/driven by motor” with “talks excessively”, “talks excessively” with “blurts out answers before questions completed”, and “blurts out answers before questions completed” with “difficulty waiting for turn”. None of the edges between the IA and HI symptoms were of large effect size. It may be worth recalling that our network used regularization to estimate partial correlation networks [7], and consequently, it showed only the more important associations or edges [5,9], suppressing spurious edges to zero. Thus, the network of associations described above is unlikely to be confounded by multicollinearity and can be considered to show relatively more meaningful relations.
For teachers views about the relationships of the ADHD symptoms with global functioning, the network analysis that included all the ADHD symptoms and global functioning (revised model) showed negative associations for IA symptoms “trouble paying attention”, “difficulty following instructions”, “trouble getting organized” and “am often forgetful”, and HI symptoms with “runs/climbs when unexpected” and “difficulty waiting for turn” with global functioning. All associations were of negligible effect sizes. Despite this, it can be speculated that “trouble paying attention”, “difficulty following instructions”, “trouble getting organized” and “am often forgetful”, and HI symptoms with “runs/climbs when unexpected” and “difficulty waiting for turn” are the more notable symptoms that are associated with global impairment.
Comparison of Findings in the Current and Past StudiesPast studies have generally supported higher centrality values for easily distracted, difficulty sustaining attention, and fidgeting [18–21]. Also, the limited data for edge weights from past studies have suggested different symptom clusters for the IA and HI symptom groups (e.g., [19,21]). There are also data indicating close links between talks and other impulsive symptoms: inattention with fidget; and runs, leaves seat, motor, fidget and quiet [19].
Based on existing expected influence (the indices used in the current study to infer centrality) in past network analysis findings for parent ratings of ADHD symptoms [20], it was suspected that “easily distracted”, and “trouble paying attention” would be among the symptoms with the higher centrality values. For edge weight, we suspected that the IA symptoms would be more closely associated with each other, and the HI symptoms more closely associated with each other, with these sets not being as closely associated with each other (or different sections of the network). In addition, the IA symptoms would be more closely associated with each other than the HI symptoms. We made no specific predictions for edge weights. Like past studies, our findings also showed that while the IA and HI symptoms were grouped together, the two groups were separated. Also, there was variability in the strengths between the nodes. However, unlike past studies, our study showed higher centrality values for IA “making careless mistakes” and “difficulty following instructions”, and HI “on the go/driven by motor” and “difficulty waiting for turn”. Furthermore, unlike past findings, our findings for edge weights involving the IA symptoms showed large effect size associations for “making careless mistakes” with “trouble paying attention”, and “easily distracted” with “easily forgetful”; and for HI, “on the go/driven by a motor” with “talks excessively”, “talks excessively” with “blurts out answers before questions completed”, and “blurts out answers before questions completed” with “difficulty waiting for turn”. Although some of our findings concur with past studies, other findings differed noticeably. Thus, as expected, the network characteristics for teacher ratings and parent ratings of ADHD symptoms are not the same. There could be several possible reasons for this. Although it is possible this may have resulted from using a nonclinical sample in the current study, this is unlikely as past findings have resulted from utilizing both clinical and nonclinical samples. Second, it could be related to the well-established very low agreement between parent and teacher ratings of the ADHD symptoms [27–30]. Third, unlike past studies that involved parent ratings (that were not nested), this study used ratings that were nested for the network analyses. It will be recalled that we interpreted the findings in our sensitivity analysis as suggesting that although the nested nature of our ratings could have impacted findings, the impact was unlikely to be overwhelming. Although our findings do not allow an evaluation of these possibilities, both explanations two and three are probable, with the second explanation being stronger.
Implications of Network FindingsThe findings in the current study have important theoretical and clinical implications in terms of how teachers view ADHD symptoms. First, our finding indicates separate groups for IA and HI symptoms is consistent with a 2-factor (IA and HI) ADHD model, as proposed in DSM-5 [26], and consistently demonstrated empirically (e.g., [32]). Indeed, this present study also found support for this model. Second, the fact that there was little separation between the HI and IA symptoms support the two-factor structure in [26,48] and not the three-factor structure proposed in [49].
Third, given that the strongest connection between the IA and HI symptoms was for IA “listen” with HI “quiet”, it could be speculated that these symptoms, at least, partially explain the close association between the IA and HI symptom groups.
Fourth, from a teacher's point of view, the variability in the strengths and directions of the associations between the nodes suggested differential association between the ADHD symptoms. From a network perspective, nodes with high centrality are viewed as more important and as having more influence in the model. Although the edge weight findings are referring to bidirectional associations that are not causal, it could be speculated that focusing on the more central nodes during intervention could be a desirable option to reduce the severity of ADHD [5,50]. Indeed, it has been suggested that modifying the more central nodes, even those shown in cross-sectional network analyses, may result in the greatest overall treatment gains [15,17]. However, as centrality indices reflect the structure of the psychological network (i.e., the presence and strength of edges) and not to the dynamics of the network (i.e., how symptoms influence each other’s presence), this interpretation needs to be with care [11,14]. Notwithstanding this, as IA “making careless mistakes” and “difficulty following instructions” and HI “on the go/driven by a motor” had the two highest centrality values, it follows that teachers consider these symptoms as core characteristics of children they rate highly on an ADHD symptom rating scale. Fifth our finds show that from a teacher’s viewpoint there were relatively low levels of associations within the IA symptoms, within the HI symptoms, and across the IA and HI symptom groups, with most of the associations being of small or negligible effect sizes, and some even negative. This was unexpected. It can be expected that all the ADHD nodes/symptoms would correlate positively and at least moderately with each other. Indeed, our CFA of the oblique 2-factor ADHD model showed that the standardized factor loadings for the different symptoms in the model were all significant (p < 0.001), and salient (>0.03). The salient loadings are indicative of a moderate correlation between the item and the factor. Considering our findings, it can be argued that from a teacher’s perspective, the findings suggest that, unlike network analysis of parent ratings of ADHD symptoms, network analysis of teacher ratings of ADHD symptoms show weaker associations with their respective latent factors.
Sixth, as the findings in the network analysis that included global functioning showed that IA symptoms for “trouble paying attention”, “difficulties following instructions”, “trouble getting organized”, “am often forgetful” and HI symptoms for “runs/climbs when unexpected” and “difficulty waiting for turn” were associated negatively and significantly with good global functioning, it can be speculated that teachers see these symptoms as relevant for ADHD and poor global functioning. In this respect, it is possible that these symptoms are especially important as they are closely associated with adaptive school functioning. As HI symptoms for “fidgets with hands/feet”, “trouble engaging in work quietly” and “talks excessively” showed positive and significant associations with poor global functioning, teachers do not see these symptoms as having relationships with poor global functioning.
Seventh our findings indicated a positive (instead of negative) relationship between 3 HI symptoms and global functioning. They were for “fidgets with hand/feet”, “trouble engaging in work quietly” and “talks excessively”. Based on the views of teachers, all these associations (especially “quite” as this symptom had one of the lowest centrality values) are seen as not supportive of their importance for ADHD. The effect sizes for these associations were low, also suggesting they are not considered worthy of attention.
Eight, the correlations between symptoms found in this study reflect correlations between underlying causal traits, raising questions whether they have evolved through editions of the DSM as alternative descriptions of the same kind of child, or indeed the same underlying trait expressed differently in different children. In this respect, it could be speculated that the latter may be the case, given the findings of strong factor loadings on the two domains despite weak correlations within domains.
Study LimitationsAlthough this study has provided new and interesting findings for teacher's views of ADHD, the findings and their interpretation must consider several limitations. Firstly, although our findings indicated stability for the edges, they did not clearly support the stability of the centrality indices. Thus, the centrality findings reported in the study have to be viewed with caution. Secondly, although the network approach assumes that the symptoms of a disorder are a causal system [5], it is not appropriate to infer causality in this study, as the study used cross-sectional data. Nevertheless, the findings can be used to eliminate spurious candidates for causal relations. Considering the sample used, the findings cannot be directly generalized to other samples, such as other age groups, including ethnic, cultural, and national groups. Relatedly, as we used a nonclinical sample, it can be expected that perhaps only around 2%–5% (the prevalence rate for ADHD) of the sample would have problems reflective of an ADHD diagnosis. Thus, it could be argued that while the findings and conclusions made in this study are applicable to the general population, it may or may not be valid for a clinical (ADHD) sample. Notwithstanding this, the findings do provide valuable clues for application for those with ADHD diagnosis. Fourthly, the findings may not be applicable to data collected via clinical interviews. Fifthly, as psychiatric comorbidities and neurodevelopmental factors may influence ADHD, the failure to control for these in the study may have confounded findings. Sixthly, as only one sample was examined, there is a need for more studies and replications before the findings can be generalized. Sixth, this study used the NC-CGAS completed by teachers and as there are no existing data supporting the psychometric properties of the teacher completed NC-CGAS, the validity of the findings for the NC-CGAS are open to question. Seventh, although our data set was nested, we did not take account of this in our analyses. This was because ethical approval for the data collected did not allow collection of demographic information of teachers, and consequently, we could not identify the teachers who completed the ratings for the different children, that is necessary for running R programs such as igraph, tidygraph, and ggraph. Notwithstanding this, our sensitivity analysis indicated significant correlations for the rank order of the expected influence centrality values across the original full sample and the reduced sample, comprising around 50% of the adolescents. We interpreted this as suggesting that the nested nature of the data in our sample was not contributing significantly to the estimation of the network parameters in the network models tested in the study
All procedures performed in the study involving human participants were in accordance with the ethical standards of the institutional and/or national research committee and with the 1964 Helsinki declaration and its later amendments or comparable ethical standards. This article does not contain any studies with animals performed by any of the authors. The research was approved by the Federation University Human Research Ethics Committee, the Federal Ministry of Education of Malaysia, and the Ministry of Education of the State of Johor (Protocol Code—2002/041, Approval Dates—27 June 2002). The research was conducted under their guidelines, and the ethical standards of the Australian National Medical Research Council.
Declaration of Helsinki STROBE Reporting GuidelineThis study adhered to the Helsinki Declaration. The Strengthening the Reporting of Observational studies in Epidemiology (STROBE) reporting guideline was followed.
The following supplementary materials are available online, Table S1: Mean and standard deviation scores for ADHD symptoms and global impairment, Table S2: Relations of symptoms, with effect sizes, within and across the ADHD domains, Table S3: Edge weights in the network, Figure S1. Standardized item factor loadings for the ADHD symptoms in the oblique 2-factor ADHD model, Figure S2. Centrality plots illustrating betweenness, closeness, degree, and expected influence values within the network, Figure S3. Edge stability estimate for the ADHD symptoms—tested using non-parametric bootstrapped estimate, Figure S4. Stability of central indices for the ADHD symptoms.
The dataset of the study is available from the authors upon reasonable request due to privacy.
Conceptualization, RG; Methodology, RG; Validation, RG, SH; Formal Analysis, RG; Investigation, RG, SH; Data Curation, RG; Writing—Original Draft Preparation, RG; Writing—Review & Editing, RG, SH, AG; Supervision, RG; Project Administration, RG.
The authors of the present study do not report any conflicts of interest.
1.
2.
3.
4.
5.
6.
7.
8.
9.
10.
11.
12.
13.
14.
15.
16.
17.
18.
19.
20.
21.
22.
23.
24.
25.
26.
27.
28.
29.
30.
31.
32.
33.
34.
35.
36.
37.
38.
39.
40.
41.
42.
43.
44.
45.
46.
47.
48.
49.
50.
Gomez R, Houghton S, Gomez A. Network analysis of teachers views of ADHD symptoms and their associations with global functioning among adolescents. J Psychiatry Brain Sci. 2025;10(4):e250005. https://doi.org/10.20900/jpbs.20250005.

Copyright © Hapres Co., Ltd. Privacy Policy | Terms and Conditions


