Location:Home >> Detail
J Psychiatry Brain Sci. 2017; 2(4): 2; https://doi.org/10.20900/jpbs.20170013
 ,
Yin Yao4*
,
Yin Yao4*
1 Department of Magnetic Resonance Imaging, Shanxi Province People’s Hospital, Taiyuan, 030001, People’s Republic of China
2 Wuxi Mental Health Center, Nanjing Medical University, Wuxi, 214151, China
3 Department of Psychological and Brain Sciences, University of Delaware, Newark, De
4 Unit on Statistical Genomics, Intramural Research Programs, National Institute of Mental Health, National Institutes of Health, NIH, Bethesda, MD
*Correspondence: Yin Yao. Rachel Amey.
Background: Recently, HSPA1A and YBX3 have been suggested as influential genes for Autism Spectrum Disorder (ASD). However, the results have shown a lack of replication.
Method: Here we performed a systematic review and a meta-analysis to explore the gene expression activity of HSPA1A and YBX3 in ASD. Fifteen RNA expression datasets of ASD case vs. control studies were acquired from Gene Expression Omnibus, including 1,534 samples (830 ASD cases, and 704 healthy controls). Both fixed-effect and random-effects models were employed for meta-analysis. Multiple linear regression (MLR) were employed to study the possible influence of the following factors: tissue, sample size, sex and racial region.
Results: Utilizing all 15 datasets, both genes presented no significant log fold change (LFC) in ASD: YBX3 (LFC = 0.001; p-value = 0.49); HSPA1A (LFC = 0.115; p-value = 0.16), but weak effect sizes for the 3 brain tissue sampled datasets: YBX3 (LOR = 0.89; p-value = 0.11); HSPA1A (LOR = 0.91; p-value = 0.086). Sample tissue is a major factor for both genes (p-value < 1.5e-04) and sex is for HSPA1A only (p-value < 0.01). Literature based pathway analysis show that YBX3 and HSPA1A may play inhibitory roles again ASD.
Conclusion: Our results suggest that YBX3 and HSPA1A may present weak protective regulation within the brain of ASD patients.
Autism Spectrum Disorder (ASD) describes a range of conditions classified as neurodevelopmental disorders with high heritability[1-3]. Both family and twin studies suggest that ASDs are highly heritable neuropsychiatric disorders[4-5]. Although the specific causes of ASD have yet to be found, it is believed that the genetic or environmental risk factors perturb common underlying molecular pathways in the brain that may contribute to the ASD pathogenesis[6].
Data from brain regions and blood at the gene expression levels were well-employed in efforts to identify ASD genetic determinants[7-9]. Recently, two novel genes, YBX3 and HSPA1A, were proposed to play significant roles in the pathogenesis of ASD[10]. The study was conducted using gene expression and large scale literature data, with pathway enrichment analysis (PEA) and network connectivity analysis (NCA) conducted to analyze the potential functional association between these two genes and ASD. However, the results were lack of replication, raising the necessity of further validation using larger datasets.
Due to limited sample sizes and specifications in terms of phenotype characteristics, results from independent studies may engender bias in their conclusions. Because meta-analyses are often used to explore the validity of findings, we propose a meta-analysis of these genes to provide insight into their effects on ASD with higher statistical reliability. Moreover, we utilize multiple linear regression (MLR) to test potential influential factors of ASD.
A systematic search was conducted by using Illumine BaseSpace Correlation Engine (http://www.illumina.com) and public functional genomics database--Gene Expression Omnibus (GEO, https://www.ncbi.nlm.nih.gov/geo/). The initial search with keywords set as ‘Autism Spectrum Disorders’. Further filter criteria includes: 1) The data organism is Homo sapien; 2) The data type is RNA expression by array or by sequencing; and 3) The study design is limited to ASD vs. healthy control cases. To note, there is no date limitation. In total, 15 studies satisfied the selection criteria and were included in this meta-analysis[11-22]. The total samples included in this study was 1,534, with 830 ASD cases and 704 controls, as shown in Table 1. The data age (current year - collection date) was from 0 to 10 years (2007 to 2017).
 Table 1. Fifteen studies satisfied the selection criteria and were included in meta-analysis
Both fixed-effect model and random-effects model were employed to study the effect size of the two genes, YBX3 and HSPA1A, in a case vs. control expression comparison. The expression log fold change (LFC) were used as an index of effect size. Results from both models were reported and compared. The heterogeneity of the meta-analysis was analyzed to study the variance within and between different studies.
2.3 Multiple linear regression analysisA MLR model was employed to study the possible influence of four factors on the gene expression change in ASD: tissue, sample size, sex and population. P-values and 95 % confidence interval (CI) were reported for each of the four factors.
Table 2 and Table 3 present the effect sizes and related statistics from the fifteen studies and the meta-analysis results for gene HSPA1A and YBX3, respectively.
 Table 2. The effects of two models for HSPA1A
 Table 3. The effects of two models for YBX3
For HSPA1A, 13 out of 15 studies included the gene and were employed for the meta-analysis. Only 11 studies included gene YBX3 and were used for its meta-analysis. We noted that the weights from the random-effects model and the fix-effect model are the same for both genes (See Table 2 and Table 3, columns ‘Weight_Fixed’ and ‘Weight_Random’). This was due to the fact that the between study variance Tau-squared, , was calculated as 0 for both genes, indicating no significant between-study variance. The total variance, Q, for the two genes were 2.22 and 2.30, with the expected variance df (under the assumption that all studies have the same effect size) of 12 and 10, respectively. This leads to p-values of 1.00 and 0.99 for the hypothesis that Q was from within-study variances only. Therefore, the following analyses will focus on results from the fix-effect model.
For HSPA1A, the effect size (LFC) from the meta-analysis was 0.11 (95 % CI: [-0.11, 0.34], p = 0.16). For YBX3, the effect size (LFC) from the meta-analysis was 0.001 (95 % CI: [-0.15, 0.15], p = 0.49). These results suggest that both genes present no significant gene expression fold change in ASD.

Fig. 1 The effect size, 95 % CI and weights for genes HSPA1A and YBX3. (a) YBX3; (b) HSPA1A. The results are from meta-analysis using a fixed-effect model.
As shown in Table 4, results from the MLR models showed that tissue was a significant influential factor for the expression fold change of both HSPA1A and YBX3 (p = 1.5E-4 and 1.0E-5, respectively) in regards to ASD. Sex was a significant factor for HSPA1A (p < 0.01) but not for YBX3 (p = 0.33). The case / control ratio and Country were not significant influential factors.
 Table 4. Multiple linear regression analysis results
Fig. 2 presents the linear regression relation (LRR) between the parameter ‘Brain Tissue’ and the expression log fold change for the two genes: HSPA1A and YBX3. From Fig. 2, it can be seen that the expression LFC of both genes were much higher in brain tissue than non-brain tissue.
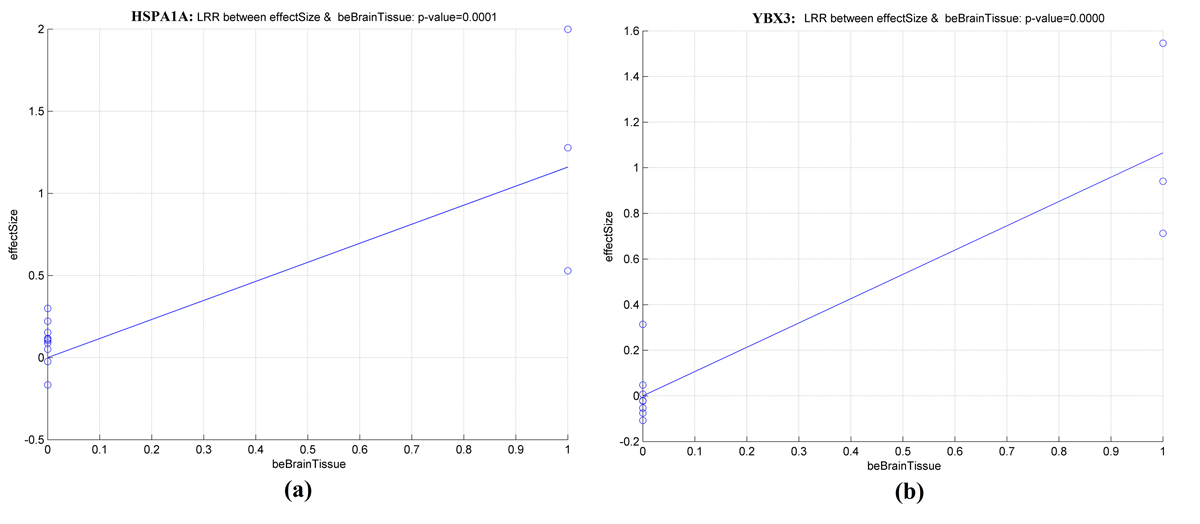
Fig. 2 Scatter plot of the linear regression relationship between ‘Brain Tissue’ samples and the expression log fold change for the two genes. (a) HSPA1A; (b) YBX3.
Considering the significant difference between expression data acquired using brain-tissue samples and non-brain tissue samples, we conducted a meta-analysis using only brain-tissue samples. Results showed that, for HSPA1A, an effect size of 0.91 (95 % CI: [-0.40, 2.22], p = 0.09) was acquired. While for gene YBX3, the effect size was 0.89 (95 % CI: [-0.55, 2.32], p = 0.11). These results indicated an existing but weak expression variation of these two genes in the brain regions of ASD patients.
This study conducted an RNA expression data based meta-analysis to explore the gene expression activity of two genes (HSPA1A and YBX3) in case of ASD. Both fixed-effect model and random-effects model were employed with heterogeneity analysis conducted. Furthermore, MLR analysis was performed to study the influence of four potential factors, tissue, sample size, sex and population, towards the effect size of these two genes in ASD.
Fifteen studies were acquired for this study, including 1,534 from human (830 ASD cases, and 704 controls), as shown in Table 1. Among these 15 expression datasets, 3 were acquired from brain tissue, and the other 12 were acquired from non-brain tissue. Using all available data for a meta-analysis, no significant fold change was observed for neither HSPA1A nor YBX3 (p-value = 0.49 and 0.16, respectively). Results were presented from fixed-effect model, as no significant between-study variance was observed in the heterogeneity analysis (HSPA1A: Q = 2.22; p-value = 1.00; YBX3: Q = 2.30; p-value = 0.99).
MLR results revealed that gene expressions sampled from brain-tissue and non-brain tissue were significantly different, as shown in Fig. 2. For both genes, the p-values were less than 0.0001 for the ‘Brain Tissue’ parameter. Considering ASD is a brain-dysfunction disease, we conducted a further meta-analysis using brain-tissue sampled data only. Results showed weak effective size for the two genes in case of ASD: (p-value = 0.086 and 0.11 for HSPA1A and YBX3, respectively). These results suggested that, in about 91.4 % of the total ASD cases, the expression of HSPA1A in the brain will present increased fold change averaged as 2^0.91 = 1.88. While for YBX3, about 89 % ASD cases will present increased expression levels averaged around 2^0.89 = 1.85 fold. These results suggested weak but possible association between ASD and HSPA1A and YBX3.
As a matter of fact, previous studies suggested that HSPA1A can activate nitric oxide (NO) syntheses[23]. Increases in NO production increases the risks of developing ASD[24]. This indicates that HSPA1A could play an inhibitive role for the development of ASD. On the other hand, it has been suggested that increased cytokine can impact neural activity and mediate the behavioral symptoms of ASD[25], while YBX3 has been shown to directly bind the nuclear factor, κB-binding element, to repress the activation of several cytokines[26]. This suggest that increased YBX3 may work as a protector against the development of ASD through a cytokines regulation channel.
The results of this study demonstrate that genes HSPA1A and YBX3 may act as protecting factors against the development of ASD, although the influential effect may result from a indirect weak regulation. The altered gene expression changes of HSPA1A and YBX3 is more likes happen in the brain tissues than non-brain tissues in case of ASD.
Authors claim no conflict of interests.
1.
2.
3.
4.
5.
6.
7.
8.
9.
10.
11.
12.
13.
14.
15.
16.
17.
18.
19.
20.
21.
22.
23.
24.
25.
26.
27.
Xu C, Zhang F, Amey R, Yao Y. Weak Association between Autism Spectrum Disorder and Two Genes YBX3 and HSPA1A – A Meta-Analysis. J Psychiatry Brain Sci. 2017; 2(4): 2; https://doi.org/10.20900/jpbs.20170013

Copyright © 2020 Hapres Co., Ltd. Privacy Policy | Terms and Conditions


