Location:Home >> Detail
J Psychiatry Brain Sci. 2016;1(3):2; https://doi.org/10.20900/jpbs.20160011

1 Wannan Medical College, Wuhu, P.R. China
2 Hanzhou Seventh People’s Hospital, Hanzhou, China
3 Anhui Normal University, Wuhu, P.R. China
4 Wuxi Mental Health Center, Wuxi, China
* Correspondence: Zaohuo Cheng, Wuxi Mental Health Center, 156, Qianrong Road, Wuxi 214151, China.
Background: Numerous studies have assessed the psychometric properties of BIS-11. But, psychometric research on the structure of the BIS-11 has been scant in different adolescent populations. This study aimed to assess psychometric characteristics of Chinese version of BIS-11 in normal adolescents, adolescents with mental disorders, delinquent juvenile and focused on testing the factor structures of Chinese version of BIS-11 based on the well-know theories in order to find appropriate structure representations of this instrument for different samples of adolescents.
Methods: The internal consistency reliability of the BIS version 11 (BIS-11) was assessed by calculating the Cronbach’s a coefficient in three separate adolescent samples: normal adolescents (n = 406),adolescents with mental disorders (n = 258), delinquent juvenile (n = 331). Confirmatory factor analysis was examined in the total sample and each adolescent sample. Omegas (w) and explained common variance (ECV) of the general factor in bifactor model were computed to measure homogeneity reliability and dimensionality of the scale.
Results: Cronbach’s a coefficients of the total BIS-11 and its subscale scores for three separate adolescent samples were all good (a=0.67-0.89). Confirmatory factor analysis showed acceptable goodness of fit indices for the three correlated first-order factor model, the six correlated first-order factor model and two bifactor models, for all adolescent samples.
Conclusion: This study suggests that the Chinese version of the BIS-11 is a reliable instrument for assessing different adolescent populations’ impulsivity. Higher order models failed to provide appropriate interpretation of this instrument for all the adolescent samples. Bifactor model, especially for bifactor model with one general factor model and three group factors, provides an alternative multidimensional structural representation to explain the dimensionalities of impulsivity, especially for bifactor model with one general factor and three group factors.
Impulsivity, as an important personality trait, is a multidimensional construct associated to act quickly without adequate thought or conscious judgment to achieve some goal and without consider future consequences [1]. Although, there are many self-report measures of impulsivity and constructs related to impulse-control, the Barratt Impulsiveness Scale version 11 [2] appears to be the gold-standard self-report instrument in this domain [3]. It has been considered a reliable and valid measure among various populations including community populations, normal adolescents, psychiatric patients, forensic populations. Barratt proposed that impulsiveness and anxiety represent orthogonal personality traits. Undergoing a long and tortuous course of development, Barratt and Patton [2] proposed there are three subtraits of impulsivity, which labeled as Motor impulsiveness (MOT: defined as acting without thinking), Cognitive impulsiveness (COG: associated to making quick cognitive decisions) and Nonplanning impulsiveness (NP: characterized as an orientation to the present or lacking of future) [3]. Patton revised BIS-10 which contained 34 items to BIS-11. This version remained 30 items and principal components analysis with promax rotation retained six oblique first-order factors and three second-order factors. The three second-order factors were same as previous studies, the six first-order factor were Attention, Motor Impulsiveness, Self-control, Cognitive complexity, Perseverance and Cognitive instability.
We know from the prior numerous studies have assessed the psychometric properties of BIS-11. When the researchers confirmed the factor structure of impulsivity, they were limited to test the original three factors of impulsivity [4-9]. Also, this case happened to china, subscale correlates based on the proposed six first-order components are rarely reported [10-12] . Given this, the current study tested not only (a) the original three factors model, (b) the six correlated first-order factors model, but also (c) the model with six first-order factors which converged into two correlated second-order factors, (d) the model with six first-order factors converged into three correlated second-order factors, and even (e) two kinds of bifactor models.
Psychometric studies of BIS-11 were assessed among adolescent samples including male Brazilian, Italian high school students, Italian college undergraduates, Chinese high school students [11,13-16].These studies have provided a prolific body of evidence suggesting good psychometric properties of BIS-11 used in normal adolescents. However, the question remains whether it should be adequately adapt to adolescents with mental disorders or in forensic adolescents. As we all know, adolescents especially for who with mental disorders or an illegal act, they have high impulsivity and therefore are at high risk of personal injury and a potential source of injury to others [14]. One of the most widely self-report impulsivity measures is Barratt Impulsiveness Scale, version 11(BIS-11). But the psychometric properties of BIS-11 [17] using in different adolescent populations rarely reported. Therefore, we test the psychometric properties of the Chinese version of BIS-11 in these three samples of adolescents (sample 1: normal adolescents, sample 2: adolescents with mental disorder, sample 3: delinquent juvenile). And we focused on testing the factor structures of Chinese version of BIS-11 based on the well-known theories and hoped to find better structure representations for scaling individual differences of different adolescent populations.
Participants were recruited from middle schools and colleges in two cities of China: Wu Xi in Jiangsu Province and Xu Chang in Henan Province. The final sample consisted 406 normal adolescents (198 males, 17.78 ± 3.69 years of age; 208 females, 16.26 ± 2.59 years of age). The participants’ age ranged from 12 to 26 years.
1.2 Adolescents With Mental DisordersThis sample of adolescents recruited from two mental health specialized hospitals, two psychological consultancies and a drug rehabilitation center in Nanjing and Wuxi, Jiangsu (China). The final sample consisted 258 adolescents with mental disorders (126 males, 17.02 ± 4.22 years of age; 130 females, 17.25 ± 3.72 years of age; 2 participants did not identify their gender). Age ranged from 12 to 26 years old. Based on the DSM- IV classification criteria, this sample included depressive disorders (n = 48),schizophrenia disorders (n = 36), substance abuse disorders (n = 30), obsessive-compulsive disorders (n = 28), tic disorders(n = 24), anxiety disorders (n = 21), bipolar disorders (n = 12), adjustment disorders (n = 11) and other (n = 48).
1.3 Delinquent JuvenileThis sample including juvenile offenders and status offenders. Juvenile offenders were recruited from inmates of youth prison, detention center and reform center in Wuxi and Zhengjiang of Jiangsu Province of China. The final sample consisted 331 delinquent juvenile (266 males, 19.02 ± 2.56 years of age; 65 females, 20.28 ± 3.02 years of age). Age ranged from 14 to 25 years old. All participants in current study have signed consents forms approved by Wuxi Mental Health Center.
2. InstrumentsImpulsivity was measured by the Chinese version of BIS-11, a 30-item scale which includes three subscales named Motor Impulsiveness subscale (MOT), Cognitive Impulsiveness subscale (COG) and Non-planning Impulsiveness subscale (NP). Each subscale has 10 items and each item has 5-point Likert responses from 1 (never) to 5 (always). The total scores of this version can range from 30 to 150. Li, Phillips, Xu et al. have reported reliability of this version: the internal consistency of 30 items scale and of the three 10-item subscales were excellent (Cronbach’s alphas were 0.77-0.89) and the test-retest reliability was good (intraclass correlation coefficient were 0.68-0.89) [17].
3. Analytic PlanFirst, basic psychometric analyses were performed for entire scale and subscales using SPSS18.0. Internal consistency reliability was assessed using Cronbach’s a, and this solution was conducted in each sample and the total sample by confirmatory factor analysis. The following models were tested and compared:
Multiple Correlated Factors Model:
Model A: three correlated first-order factors proposed by Barratt; Motor impulsiveness, Cognitive impulsiveness, Non-planning impulsiveness [17].
Model B: six correlated first-order factors proposed by Patton; Attention, Motor impulsiveness, Self-control, Cognitive complexity, Perseverance, and Cognitive instability [2]
Higher Order Model:
Model C: Fossati proposed two second-order factors based on Patton’s six first-order factors; Attention, Motor impulsiveness, Perseverance, Cognitive instability were converged into General Impulsiveness; Self-control, Cognitive complexity were converged into Non-planning Impulsiveness [14].
Model D: also based on Patton’s six first-order factors, and Patton explored three second-order factors. The first-order factor Perseverance, Motor impulsiveness were converged into the second–order factor Motor; Cognitive instability, and attention were converged into Attention impulsiveness; Self-control, and cognitive complexity were converged into Non-planning impulsiveness [2].
Bifactor Model:
G-3 Model: this is a bifactor model with one single general factor and three group factors (three group factors are according to Barratt’s original 3 factors’ theory).
G-6 Model: this is a bifactor model with one single general factor and six group factors (six group factors are according to Patton’s six factors’ theory).
The current study applied Amos 22.0 with maximum likelihood estimation of the multiple correlated factors model and the higher order model to test model validation validity, allowing model correction; and applied Mplus 7.0 with maximum likelihood estimation to verify validity of bifactor model.
The present study provided the following goodness-of-fit indices: c2-degrees of freedom (df) ratio (c2/df), a c2/df ratio above 5.00 represents an inadequate fit; the Root Mean Square Error of Approximation (RMSEA) ,RMSEA values of .08 or lower indicate adequate fit; Goodness- of-Fit (GFI) higher than 0.90, adjusted goodness of fit index (AGFI) higher than 0.80 indicate good fit; Akaike Information Criterion (AIC) and Baye’s Information Criterion (BIC) are used for model comparison, with smaller values demonstrated a better model fit; Icreamental Fit Index (IFI), Tucker-Lewis index (TLI) ,Comparative Fit Index (CFI) when higher than 0.90 indicate good fit; Standardized Root Mean Square(SRMR) should be lower than 0.05[19-21].
We also calculated w-hierarchical (wh) coefficients to assess the bifactor model based reliability coefficients of all included items. Since in the bifactor model, the item responses are assumed to influenced by both the general factor and the specific group factors. Values of wh coefficient ranges 0 to 1, with higher scores indicating greater reliability [22]. We compute the proportion of explained common variance(ECV) of the general factor to make decisions about the dimensionality of data. The ECV is the ratio of the explained variance by the general factor divided by the variance explained by both general and subgroup factors. When the ECV for the general factor in a bifactor model is less than 0.70, there is enough multidimensionality in the data to warrant modeling it with MIRT(Multidimensional Item Response Theory) [22,23].
The Cronbach’s a for COG (Cognitive Impulsiveness) subscale of sample 1 was 0.67, it is somewhat lower than other subscales’ and total of other samples, Other Cronbach’s a were greater than 0.79 which indicated high internal consistency (Table 1). The results indicated there were significant differences (MOT: F(2,992) = 24.54, p = 0.000;COG: F(2,992) = 19.24, P = 0.000; NP: F(2,992) = 20.55, P = 0.000; Total score: F(2,992) = 36.18, p = 0.000). And examination of SNK-q test of three samples show us sample 2 and sample 3 were significantly more likely to have higher scores on all subscales and total scale than sample 1. There were no significant difference on the scores of MOT and NP subscale between sample 2 and sample 3. But on COG subscale and Total scale, the scores of sample 3 were more likely to be higher than sample 2.
2. Factor Structure Analysis 2.1 Multiple Correlated Factors Model Table 1 Descriptive Statistics And Internal Consistency of the BIS-11 in the Different Sample
In the total sample and three separate adolescent samples, χ2/df of Model A and Model B were less than 5.00. 90 % confidence interval of RMSEA did not include 0.08. And GFI, and AGFI were according to the standard (value is greater than 0.80, meaning model is reasonable) supported by Baumgartner and Homburg [24]. IFI,TLI, and CFI were good at the value around 0.90. The value difference of these two models’ AIC, BIC were small, indicating that Model A and Model B were both good.
The basic goodness of fit in the model is checked through the standardized factor loading values and correlation coefficients of the factors. The result shows that the standardized factor loading values and correlation coefficients have a similar trend when fitting each sample with those two models, the present study reported only the model fit indices of the model in the total sample. The three-factor model’s standardized factor loadings was showed in Figure 1, which was generally acceptable. For the six-factor model, the six factors’ correlation coefficients r is in the range of 0.16-0.98 (P < 0.001). Except the item 29 (l= 0.21), other items’ factor loading is in the range of 0.39 - 0.78, generally meeting the model fit standard.
 Table 2 Goodness of Fit Indices of Multiple Correlated Factors Models
Table 3 displayed goodness of fit indices of the two higher order models in all adolescent samples. When Fossati’s higher order model matched to the total sample, χ2/df value was greater than 5.00. And GFI, AGFI, IFI, TLI, CFI were all good. But 90% confidence interval of RMSEA were all included 0.08, indicating this model may questionable. Patton’s higher order model had a similar model fit indices with Fossati’s higher order model.
The result also showed that the standardized factor loadings and correlation coefficients had a similar trend when fitting each sample with the two higher order models. So the current study reports the total sample’s condition. Fossati higher order model: the correlation coefficient between two second order factors (General Impulsiveness, Nonplanning impulsiveness) was acceptable (r = 0.81, P < 0.05);but when the first order factors (perseverance, Motor impulsiveness loaded on General Impulsiveness, factor loadings were 0.22 and 0.11, the value were too low. Patton higher order model: the correlation coefficient between three second order factors were 0.17-0.90 (P < 0.001).The standardized factor loadings were 0.57-1.18, When first order factors loaded on second-order factors; when Perseverance loaded on Motor Impulsiveness, the factor loading value was 1.18; other standardized factor loadings were all below 1.00.
 Table 3 Goodness of Fit Indices of Higher Order Models
Table 4 displays goodness of fit indices of bifactor models in all adolescent samples. The chi-square value for MLM(maximum likelihood parameter estimates with standard errors and a mean-adjusted chi-square test statistic that are robust to non-normality) cannot be calculated by Mplus software. we just got SB chi-square. The ML chi-square derived from product of SB-c2 and scaling correction factor for MLM. So, thec2/df displayed by Table 4 is MLc2/df. Observed in Table 4 that in bifactor models, in all samples, model with 3 group factors seems better fitted the data than model with 6 group factors. And the bifactor model with 3 group factors was very fitted the data of forensic adolescents (c2/df =1.76, RMSEA = 0.034, TLI = 0.94, CFI = 0.95, SRMR = 0.05).
The result of CFA showed standardized factor loadings and correlation coefficients had a similar trend when matching each sample with the two bifactor models. So the present study reported the total sample’s condition. Fig 2 presents the standardized factor loadings of G-3 Model, the general factor loadings for 21 items were acceptable (l >0.30), but there still 9 items with low factor loadings (e.g., item 23 and 29) below 0.30. Generally, the factor loadings of the general factor were acceptable (M = 0.42), ranging from -0.24 to 0.76. The factor loadings of the group factors were also acceptable (M = 0.32), with 14 of the 30 items presenting loadings over than 0.30. For G-6 Model, the standardized factor loadings were not as good as in G-3 Model.
 Table 4 Goodness of Fit Indices of Bifactor Models
As can be seen in Table 5, the reliability coefficient (wh) of the total score in Model E were ranged 0.75 to 0.83 in all adolescent samples, which indicates good reliability. The wh in Model F were ranged 0.80 to 0.87 in all adolescent samples, indicating good reliability. In these two bifactor models, the explained common variance (ECV) of the general factor were all lower than 0.70, indicating this instrument is multidimensional.
 Table 5 The Reliability of Bifactor Model
The present study examined the homogeneity reliability of the Chinese version of BIS-11 and tested different theories of the BIS-11 construct validity of this version in different adolescent samples. Cronbach’s a were calculated by the total BIS-11 and its subscale scores for three separate adolescent samples to evaluate the internal consistency of this instrument. Except the Cronbach’s a of COG subscale for normal adolescents had somewhat lower value, other Cronbach’s a of subscale and total scale for each sample were excellent. Compared with the adaptation of BIS-11 in Brazilian adolescents, Italian adolescents, the current study presented a better internal consistency of BIS-11 [13,14]. And in those three different adolescent samples, this version of BIS-11 all acquired satisfactory scale homogeneity results. Comparison of three samples’ descriptive statistics indicated this version of BIS-11 is sensitive to differences in levels of different populations. The subscale and total scale scores of mental disorders and delinquent juvenile were all higher than normal adolescents. That suggests this version of BIS-11 has good empirical validity and is also a good instrument to use in assessing mental disorders’ and forensic population’s impulsivity.
Based on comprehensive analysis on goodness of fit of the three kinds models with corresponding samples, the present study found that expect Fossati’s higher order model with poor performance, other models had well goodness of fit. Review indicators (AIC and BIC) and value-added fit statistics (TLI, CFI or IFI) both showed that Bifactor Model is not as simple as the Multidimensional Model and Higher order Model. Generally, multiple correlated factors model has best goodness of fit because Barratt’s Three-factor Model and Patton’s Six-factor Model both meet satisfactory standards in goodness of fit. In addition, three separate adolescent samples are all suitable for these two models. When Someya verified Barratt’s original three-factor structure of BIS-11 in Japanese version, he found the model was of well goodness of fit, which was also verified by Vasconcelos’ research [13]. From the result of confirmatory factor analyses of the original three-factor structure, the current study found that three-factor structure had well goodness of fit with the total sample and the three separate adolescent samples. Therefore, impulsive personalities of normal adolescents, adolescents with mental disorders and delinquent juvenile can be explained by the total score of BIS-11 and three subscales’ scores. The six factor model was initially found by Patton with principal component analysis [2]. After that, researchers lead by Fossati tested the Italian version of BIS-11among adolescents which showed well goodness of fit [12]. However, the results of Reise’s verification of English version of BIS-11 for normal adults showed the first-order correlated Six-factor Model had poor goodness of fit [13]. In addition, Preuss’ verification of German version of BIS-11 for control persons, patients with alcohol dependence, suicide attempts and borderline personality disorders showed that Patton’s Six-factor Model had poor goodness of fit [25]. Therefore, the six correlated factors’ structure of BIS-11 may be significantly affected by different languages and cultures, which makes its goodness of model fit not as stable as that of original three-factor structure’s performance across different languages, cultures and different populations. Maybe that is why so few researchers preferred to research the six-factor structure and most researches prefer the three-factor structure. However, the results of this paper showed that the six-factor structure can be also applicable for different adolescent populations under Chinese culture, which means that the six-factor structure can explain the impulsiveness scores of different adolescent populations.
The result showed that Fossati’s higher order factor model was not adapted to this version of BIS-11, while Patton’s higher order factor model had acceptable goodness of fit. Second-order factors of higher order model are usually defined not by observable variables but by first-order factors, which makes it unpredictable and the explanation of factor loading unclear (for example, sometimes the standardized factor loading of first-order factor on second-order factor is higher than 1.00).The higher order model uses second-order factors to explain the common effect of multiple dimensions and uses residual errors of first-order factors (after explained by second-order factors) to explain specific effects of each dimension. Although the common effect and special effects are separated in this way, dimension specify are restrained due to the emphasis on the common properties among dimensions. In the present study, even its goodness of model fit was acceptable, Patton’s higher order model also showed that factor loading incomprehensible (the standardized factor loading was 1.18 when first-order factor, perseverance, loaded on Motor Impulsiveness), and rationality of this model was questionable to some degree (90 % confidence interval of RMSEA included 0.08). The bifactor model divides the common effect into general factor’s variations and group factors variation, which investigating not only the commonality of all items (i.e. the effect of general factor), but also specific effect of each dimension (i.e. the effects of group factors). This hits off faults of the higher order model compared with bifactor model (Both bifactor and higher order factor models have hierarchical structures. However, the general factor in bifactor models has only direct effects on test items, whereas the higher order factor has only indirect effects). The present study tested the bifactor model of impulsiveness (a multidimensional personality).
The results showed that the bifactor model had well goodness of model fit, although it was not as simple as multiple correlated factors model and higher order model. The CFI,TLI,RMSEA,AIC and BIC each include a penalty for model complexity, which result in penalizing the bifactor model more than the higher order model and multiple correlated factors model because the bifactor model is less parsimonious (i.e., requires more parameters to be estimated) than higher order model and multiple correlated factors model [26]. In term of the model fit of bifactor model of this instrument and its interpretation of general factor and group factors, the present study preferred the bifactor model to interpret the total and subscale scores of this instrument. The bifactor model has more advantages in explaining impulsiveness scores of BIS-11 for abnormal adolescents. Adolescents with mental disorders and delinquent juvenile had better model fit of the G-3 Model compared to sample of normal adolescent. From the model fit indices of G-3 Model in delinquent juvenile sample, we know the G-3 Model can better explain impulsiveness of delinquent juvenile than higher order model and multiple correlated factors model.
Bifactor model can be thought of as a helpful tool for measuring homogeneity reliability and the dimensionality of scales [23,27]. So our study investigating the omegas and explained common variance(ECV) of the general factor in bifactor model. The wh of two bifactor models both with high values indicates greater reliability of these two bifactor model. That means the instrument’s sum score measures the target construct with perfect accuracy. The ECV values of general factors in two bifactor model indicates this instrument is multidimensional. Subscores for the multiple subscales could provide added value over simply reporting a total score. The values of omegas and ECV of general factor were good in all samples, especially for G-3 Model, which indicating the theoretical structure (three correlated factors model) of Chinese version of BIS-11 is good.
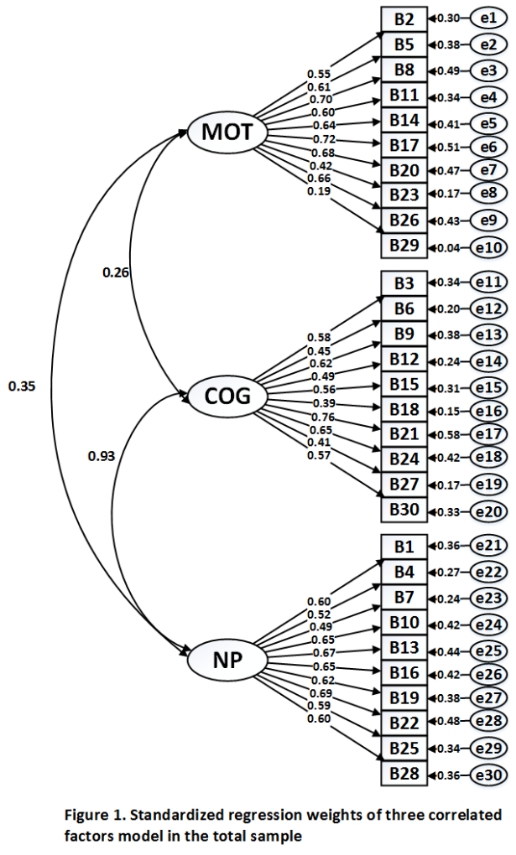 Figure 1. Standardized regression weights of three correlated factors model in the total sampla
 Figure 2. Standardized regression weights of Bifactor model in totoal sample
1.
2.
3.
4.
5.
6.
7.
8.
9.
10.
11.
12.
13.
14.
15.
16.
17.
18.
19.
20.
21.
22.
23.
24.
25.
26.
27.
Wan Y, Zhang M, Jin F, Cheng Z. The Chinese Version of the Barratt Impulsiveness Scale-11: Reassessment of Its Psychometric Properties in Three Adolescent Samples. J Psychiatry Brain Sci. 2016;1(3):2; https://doi.org/10.20900/jpbs.20160011

Copyright © 2020 Hapres Co., Ltd. Privacy Policy | Terms and Conditions


